Halloween Special - Limited Time 70% Discount Offer - Ends in 0d 00h 00m 00s - Coupon code: sntaclus

You want to connect a Tableau workbook to a dataset in a Microsoft Excel spreadsheet.

What should you do from Tableau Desktop?

A.

From the Data menu select New Data Source

B.

From the Data menu select Replace Data Source

C.

From the File menu select Import Workbook

D.

From the File menu select New

You have the following dashboard that contains two visualizations.

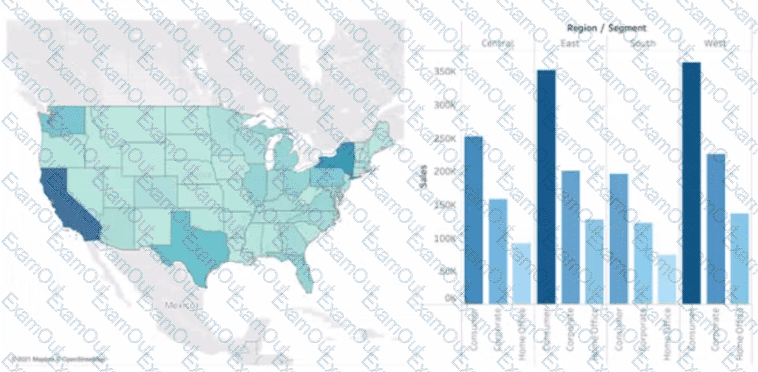
You want to show only one visualization at time. Users must be able to switch between visualizations.

What should you me?

A.

A parameter and a calculated filed

B.

Worksheet actions

C.

Show/hide buttons

D.

Dashboard actions

You have the following line chart that shows the average sales by month.

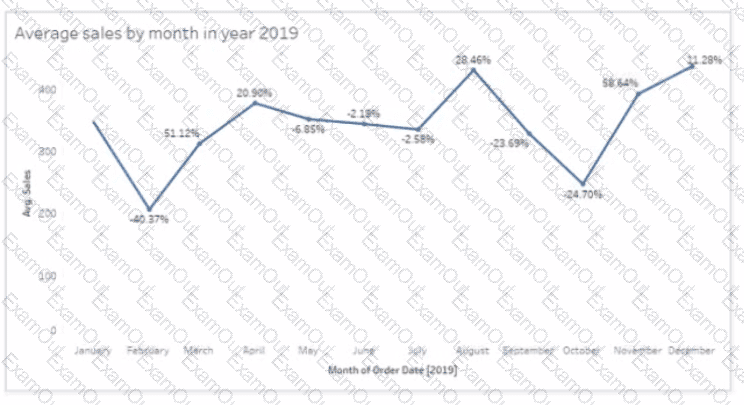
Which month had the biggest increase in swage sales compared to me previous month in 2019?

A.

August

B.

October

C.

December

D.

November

You have a dashboard that contains confidential information about patients health. The data needs to always be up to date tor a team of healthcare workers How should you share me dashboard with the healthcare workers?

A.

Publish the dashboard to Tableau Public

B.

Print the dashboard to PDF

C.

Publish the dashboard to Tableau Server

D.

Export the dashboard as a .twbx

You want to add a comment to March 2020 as shown in the following visualization.

You have the following sets in a Tableau workbook

• Top N Customers

• Customers of 2020

• Top N Products

• Sellers of 2020

Which two sets can you combine? Choose two

A.

Sellers of 2020

B.

Customers of 2020

C.

Top N Products

D.

Top N Customers

You plan to create a visualization that has a dual axis chart. The dual axis chart will contain a shape chart and a line chart will use the same measure named Population on the axis.

You need to configure be shapes to be much larger than the line.

What should you do?

A.

Duplicate Population Drag the duplicate to the second Marks card and configure the see of the marks independently

B.

Create a custom shape that is larger than the default shape and add the shape to the Shapes folder in My Repository

C.

For the second axis select Shape on the Marks card From Select Shape Palette select Custom and then select Reset

D.

Change Population to a discrete dimension

You publish a dashboard tut uses an attract. The extract refreshes every Monday at 10:00.

You need to ensure that the extract also refreshes on the last day of the month at 18:00.

What should you do?

A.

From Tableau Desktop, open the Publish Workbook dialog box and configure the schedule.

B.

From Tableau Server select the workbook select Refresh Extracts and then add a new extract refresh

C.

From Tableau Server. select Schedules find the schedule of the extract, and change the frequency to the Last day of the month

D.

From Tableau Server. select Schedules and change the priority of the existing schedule

You have a database that includes field named sales, City and Region.

You have the following chart that shows the number of sales made in different cities.

You want to dynamically show the corresponding region when users hover their mouse over any of the bars.

What should you do?

A.

Right-click a in the chat, select Annotate and then select Mark.

B.

Right-click a bar in the chart select Mark Label and then select Always show.

C.

Edit the aliases for City.

D.

Drag Region to Tooltip on the Marks card

A Data Analyst is subscribed to several views.

The analyst needs to unsubscribe from the views.

What should the analyst use?

A.

The Shared with Me page

B.

The Notifications area of Tableau Prep

C.

The Data Source page of Tableau Desktop

D.

The My Content area of Tableau Server / Cloud

A Data Analyst has the following chart that shows the cumulative volume of sales from various dates.

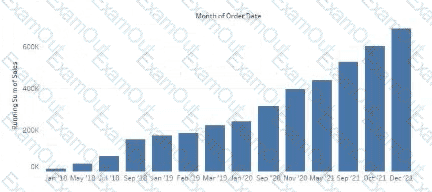
The analyst wants the months to appear as shown in the following chart.

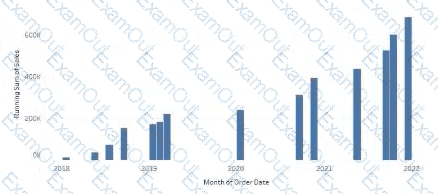
What should the analyst do?

A.

Convert the date to Exact Date

B.

Change the Sort Order

C.

Convert the date to Continuous

D.

Convert the date to Attribute