A Data Analyst has the following dataset in Microsoft Excel.
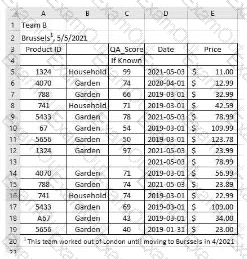
The analyst is using Data Interpreter to cleanse the dataset. Data Interpreter provides the following results.
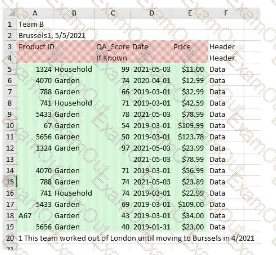
How many rows of data will be ingested into Tableau as values?
You have the following dataset that contain null values in the Profits field.
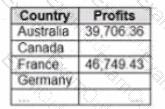
You want the data to appear as shown in the following table.
Which two formulas achieve the goal? Choose two.
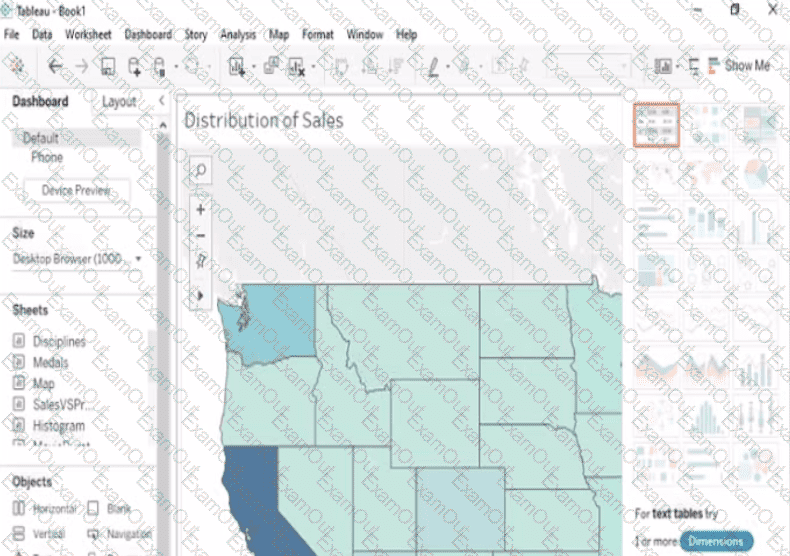
A Data Analyst has the following dashboard.
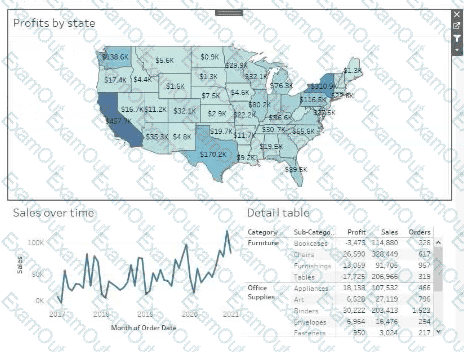
Currently, the map is used as a filter that affects the data on the other sheets of the dashboard.
The analyst needs to configure the dashboard to ensure that selecting a data point on the map only filters the Detail table.
What should the analyst do?
in which three formats can you export a worksheet from the Worksheet menu? Choose three
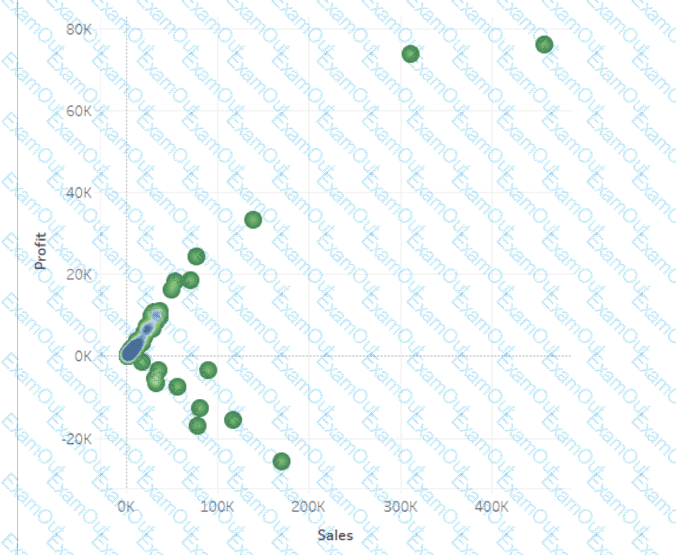
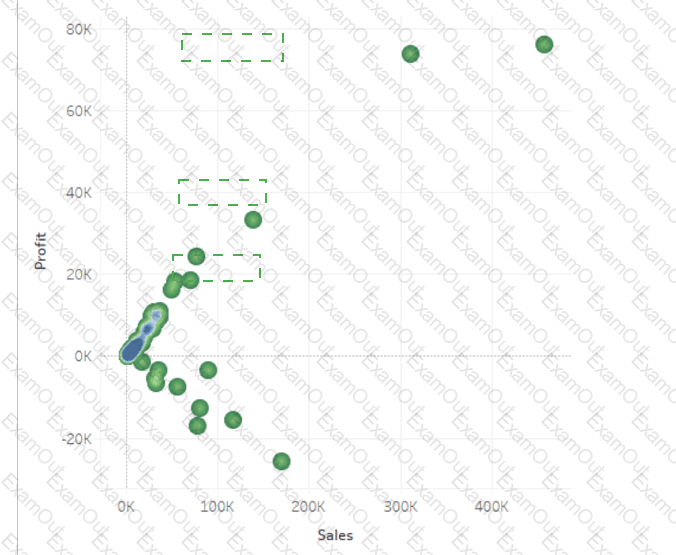
You have a data set that contains three columns named Sales, Profit, and Quantity.
You need to build the following scatter plot.
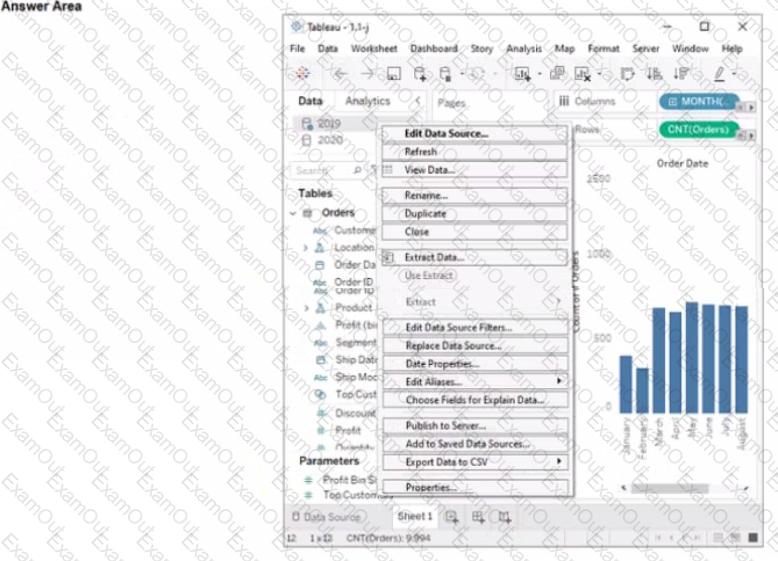
You have two data sources that use the same schema One data source contains order data from 2019 and the other data source contains order data from 2020.
You have a worksheet that shows the orders from 2019.
You need to configure the worksheet to show the orders from 2020 without reloading the data.
Which option should you select?

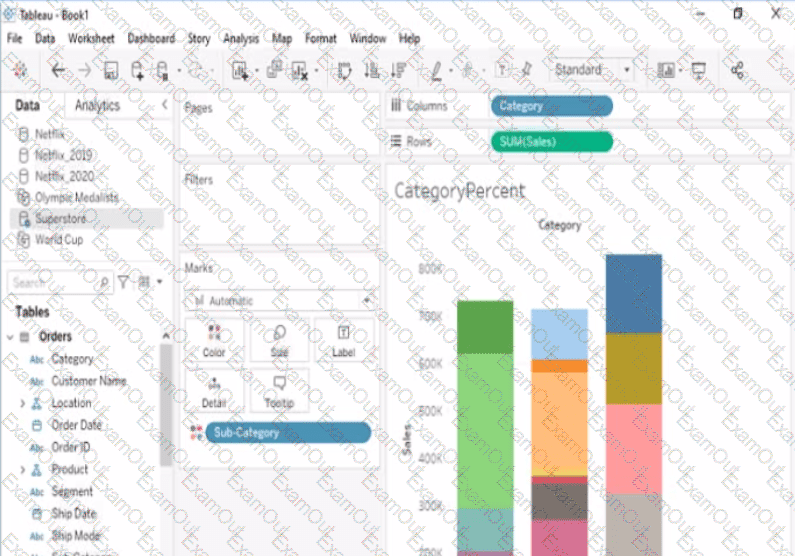
Open the link to Book1 found on the desktop. Open the CategoryPercentage worksheet.
Modify the bar chart show the percentage of sales for each Subcategory within every Category. The total percentage for every Category must be 100%.
Open the link to Book1 found on the desktop. Use the Superstore data source.
Split the Customer Name field into two fields named First Name and Last Name.
Open the link to Book1 found on the desktop. Open the Histogram worksheet and use the Superstone data source.
Create a histogram on the Quantity field by using bin size of 3.
Open the link to Book1 found on the desktop. Open the sales dashboard.
Add the Sales by State sheet in a Show/Hide button to the right side of the dashboard.
