A client wants to migrate their Tableau Server to Tableau Cloud. The Tableau Server is configured with three sites: Finance, Strategy, and Marketing. A
consultant must provide a solution that minimizes user impact and costs.
Which configuration should the consultant recommend for Tableau Cloud to meet the client's requirements?
A client is working in Tableau Prep and has a field named Orderld that is compiled by country, year, and an order number as shown in the following table.
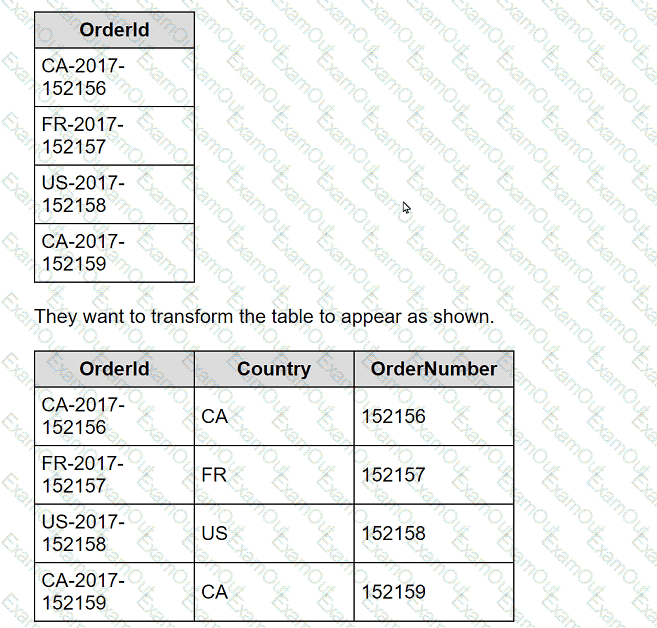
What should the consultant use to transform the table in the most efficient manner?
A client is searching for ways to curate and document data in order to obtain data lineage. The client has a data source connected to a data lake.
Which tool should the consultant recommend to meet the client's requirements?
A client calculates the percent of total sales for a particular region compared to all regions.
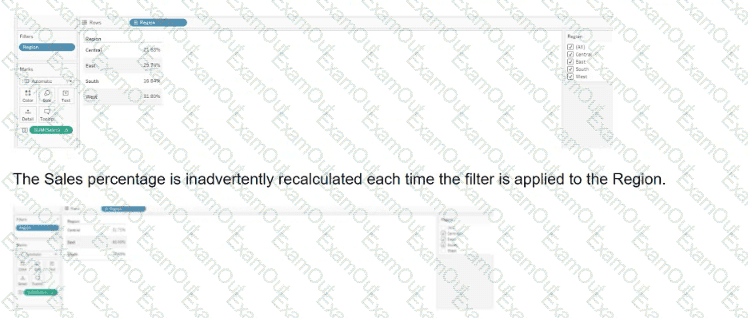
Which calculation will fix the automatic recalculation on the % of total field?
A consultant is working with a Tableau Server customer. The customer asks the consultant if there is a need to upgrade their instance of Tableau Server that was installed over 1 year ago.
Which two situations justify the need for an upgrade? Choose two.
A client has a database that stores widget inventory by day and it is updated on a nonstandard schedule as shown below.
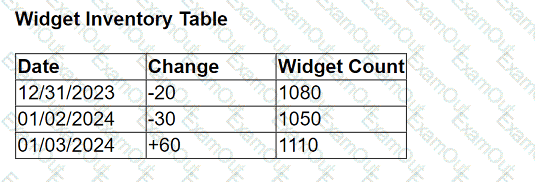
They want a data visualization that shows widget inventory daily, however their business unit does not have the ability to modify the data warehouse
structure.
What should the client do to achieve the desired result?
A client needs to design row-level security (RLS) measures for their reports. The client does not currently have Tableau Data Management Add-on, and it
may be an option in the future.
What should the consultant recommend as the safest and easiest way to manage for the long term?
A client has a sales dataset that contains fields named Customer ID, Region, Item, and Sales Amount. Each row represents a single sale. There may be multiple sales for each Customer ID.
The client wants to visualize the average total customer sales by region.
Which Level of Detail (LOD) expression should a consultant recommend?
A customer plans to do an in-place upgrade of their single node Tableau Server from 2023.1 to the most recent version.
What is the correct sequence to prepare for an in-place upgrade?
A client is using the Tableau Content Migration Tool to move content from an old Tableau Server to a new Tableau Server.
Which content will need to be moved using a different tool or process?
