Refer to the exhibit.
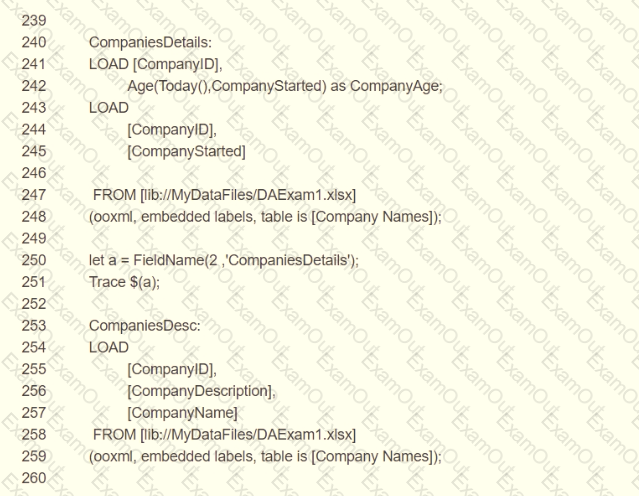
A business analyst reports that the 'CompanyAge' field does NOT display for users The data architect examines the LOAD script and wants to place the breakpoint in the script to check the field name.
Which line number should the data architect use?
Refer to the exhibits.
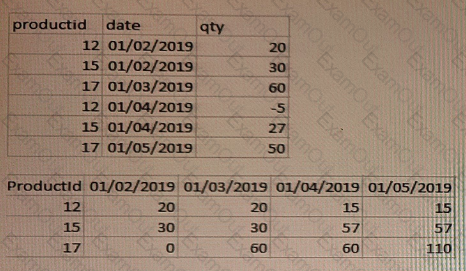
The first table shows the source table (Original table).
This data represents the stocks stored every month for each product:
• The relevant fields are productid, qty, and date.
• The date field represents the calendar months using
• The qty field shows the product stock fluctuation from the current month versus the previous month. If there is no fluctuation between months, there are no new entries in the table.
The second table shows a Pivot table visualization the data analyst needs to create in the app displaying per each product the monthly trend of available stock.
For performance reasons, the data analyst requests the data architect to calculate the running stock quantity of each product for every month in the script.
Which approach should the data architect use?
A customer has a dataset that contains latitude and longitude data for service points around the country. The data is retrieved using the following statement:
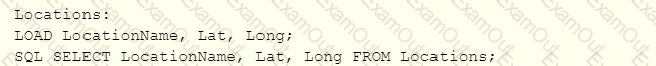
It must be clear to the end user that this is geographic data. Drag and drop, map-based visualization of this data is required. Which two steps should the data architect take to support this data? (Select two.)
Refer to the exhibit.
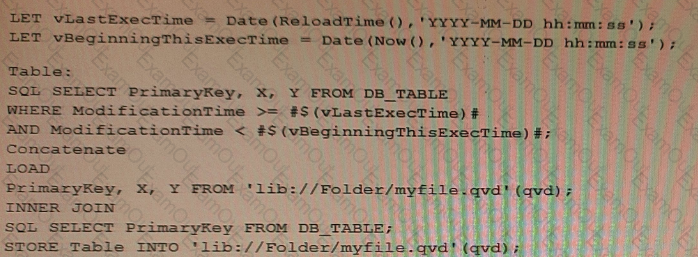
Which changes on the database will the script capture?
A data architect builds a data model for a large user group. Some sheets will be published, and the app will allow users to create their own visualizations and analyze data. Some fields must NOT appear in any field list.
How should a data architect meet these requirements?
A data architect needs to arrange data to create an app with a map where multiple location points consolidate into hexagonal areas based on postal codes
The areas will be color coded based on the number of vendors in the location.
Which GeoAnalytics operation should the data architect use?
A company needs to analyze sales data based on the exchange rate of the different countries every day About 30 reports must be produced with an average of 20r000 rows each. This process is estimated to take about three hours.
Reports will be in Excel and distributed to business users according to defined security rules
Which two products should the data architect use to build this solution? (Select two.)
Refer to the exhibit.
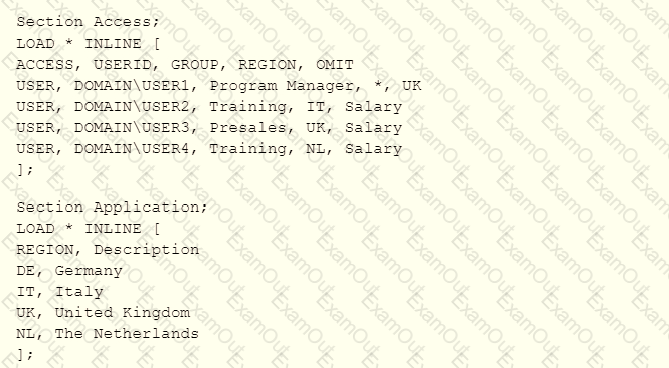
USER1 has an app protected using this Section Access statement.
Which countries can USER1 see in the app''
Refer to the exhibit.
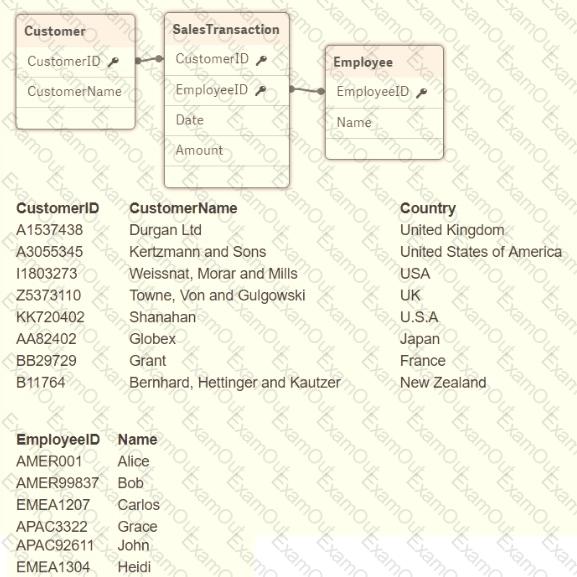
A global sales organization operates in three regions: AMERICAS, EMEA: and APAC. Each region stores its sales transactions in a separate database in which the employees update customer data through a third-party app. The data is extracted into three QVDs.
A data architect sets up a two-tier architecture for the data load. The data architect needs to add the region to the data model.
Which technique should the data architect use to create the Region field?
Refer to the exhibit.
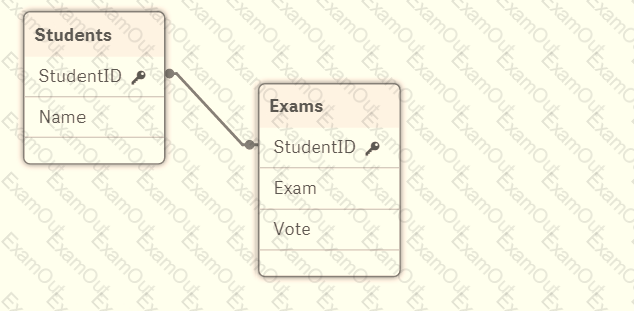
A data architect builds a simple data model to show the relationship between students and exams. The data is loaded. Every StudentID in the Exams table should be found in the Students table. Some students have NOT taken an exam.
The data architect selects the field "StudentID" from the Students table and sees the following:

A data architect needs to fix this anomaly.
What should the data architect do to ensure data integrity?
