The Japanese born function of a Kaizen event utilizes a specific, step-by-step approach meant to bring about major changes to a process.
To properly analyze the variables impacting the output of a process we need to collect data that represents at least 80% of the variation in the process and assure ourselves we are collecting data from all three types of variation which are _______________.
In a Fishbone Diagram the 6M’s stand for Methods, Measurements, Machine, Man, Mother Nature and ____________ .
A natural logarithmic base is not required for which of these distributions for probability calculations?
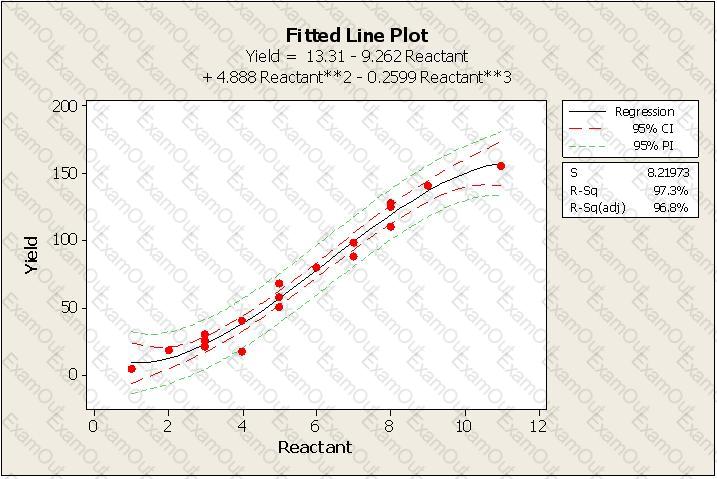
Which statement is NOT correct about the Fitted Line Plot shown here?
Which of these are examples of business metrics or Key Performance Indicators commonly referred to as KPI’s?
An operator checks that all boxes being packed contain enough products to fill the box. However, each box getting filled has a different number of products in it. This is a Reproducibility problem, not a Repeatability problem.
Customers make their decisions based on Features, Integrity (of the seller) Delivery and ___________?
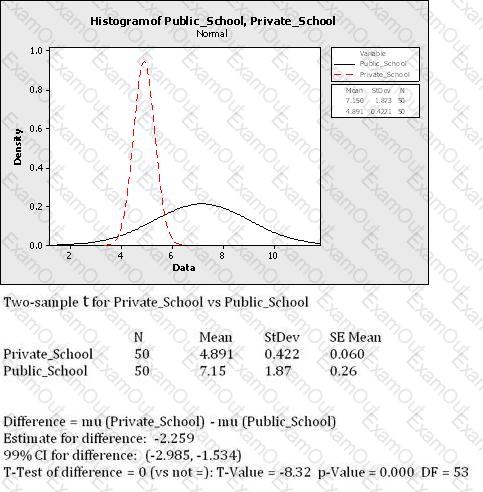
The class score distribution of schools in a metropolitan area is shown here along with an analysis output. Comment on the statistical significance between the Means of the two distributions. Select the most appropriate statement.
Contingency Tables are used to test for association, or dependency, between two or more classifications.
