The analyst is exploring weekly sales revenue in the last 3 months using a line chart. One requirement is to show the sales target $30,000 in the chart.
Which solution can help the analyst display the sales target?
Users find it difficult to distinguish the dashboards they need for tracking sales performance. There are more than 30 operation-related dashboards in the same folder.
What should the analyst do to improve the navigation experience?
An analyst has a dashboard with a single filter on Created Date “is in the past year”, but a tile on the dashboard is returning results for only the past 7 days. When the analyst selects “Explore from Here” on the tile, there are filters on both Created Date “is in the past year” and Created Time “is in the past 7 days”.
How should the analyst make sure that only the filter set on the dashboard is applied to the tile?
An analyst needs to compare monthly sales, year over year, based on when an order was created, as shown in the exhibit.
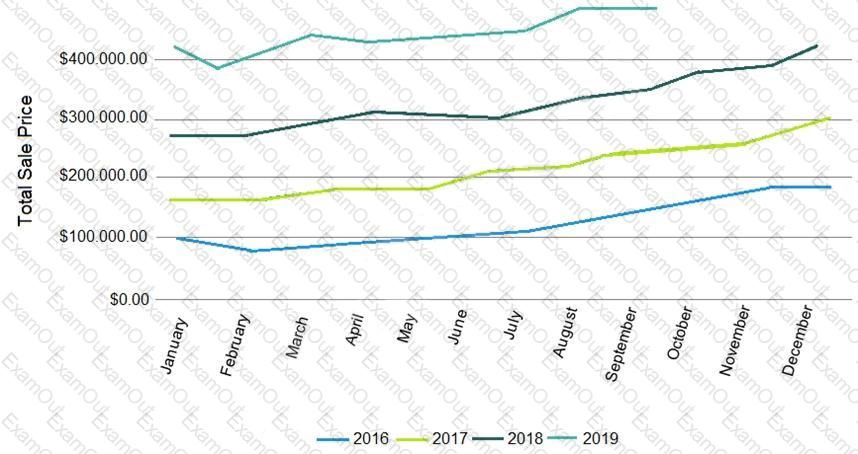
How should the analyst, in addition to selecting the measure Total Sales build the report?
An analyst needs to send a Look to an external client in CSV format. When the data is being downloaded, the Limit section has the option to select All Results grayed out, with text reading “All Results Unavailable.”
What are three causes of this message? (Choose three.)
Two users report seeing different results on the same dashboard.
Which three configurations could explain these discrepancies? (Choose three.)
An analyst adds a Day dimension and a Signup Count measure to an Explore to show the number of new users added per day. The analyst wants to add a metric that increases by the number of new users per day, on a rolling basis.
How should that metric be calculated?
A business analyst is building a report of predicted sales. The business analyst wants to filter the results to only show dates in the next seven days. This filter should work whenever the results are generated.
Which filter expression should the business analyst use?
An analyst needs to select all users in the query results but only wants to visualize results for users that have more than 100 orders.
Which visualization option should the analyst utilize?
An analyst creates a table visualization. There is one dimension, a few count type measures, and a percentage table calculation. When the analyst tries to download all 200,000 rows of results in CSV, the option is unavailable. The analyst has been provided permission to download all results.
Which action should the analyst take to download all results?
