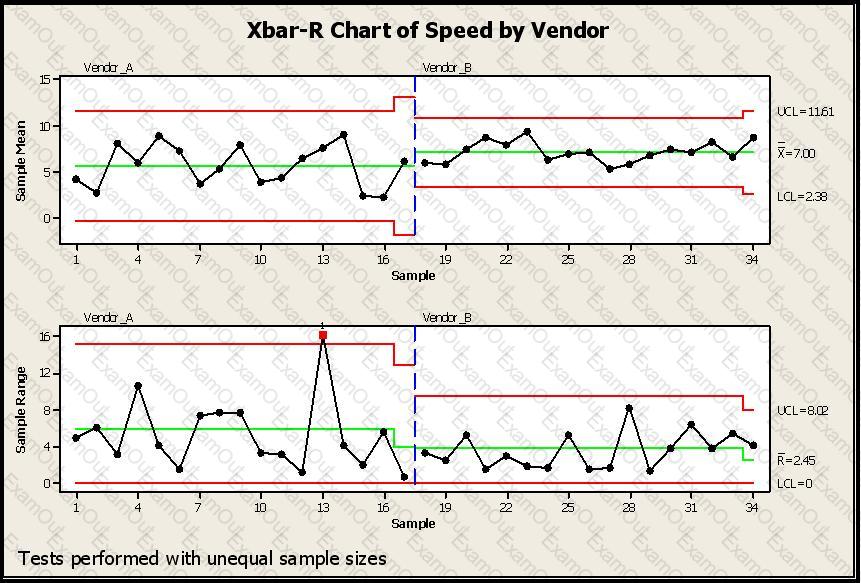
SPC Charts are used extensively in different business and decision-making environments. In this example a vendor is being selected based on speed of delivery. Which of the conclusions would help you pick a vendor for your needs regarding lead-time of delivery from your vendors? (Note: There are 4 correct answers).

Relative to a Design of Experiments the term ________________ refers to variables being a linear combination of each other.
For a Normal Distribution as samples size increases the Range in Mean and Standard Deviation decrease relative to the Mean and Standard Deviation of the population.
A(n) ________________ has occurred when two inputs have a greater impact on a change in the output than either of the inputs has by itself.
When the Inputs, X’s, for your process are Normally Distributed about the Mean, the Outputs, Y’s, will always be Normally Distributed.
If a Six Sigma project was to reduce repair station inventory and the team found the inventory was creeping up over time which Lean tools should be considered in the Control Phase to reestablish and sustain the project success?
Sally and Sara sell flower pots at their garage sale. Sally motivates Sara mentioning that they will sell a minimum of 22 pots per day if the outside temperature exceeds 60o F. From a sample, whose population is assumed to follow a Normal Distribution, taken for 30 days at 60 degrees or more an average of 18.2 pots per day were sold with a Standard Deviation of 0.9 pots. What is the Z value for this sales process?
A Non-parametric Test should be used if just one distribution is not Normal out of the two or more gathered.
Control Charts were developed by Dr. Shewhart to track data over time. To detect Special Cause variation the Control Charts use which of these?
Data that can be measured on a continuum and has meaningful decimal subdivisions are __________ data.

