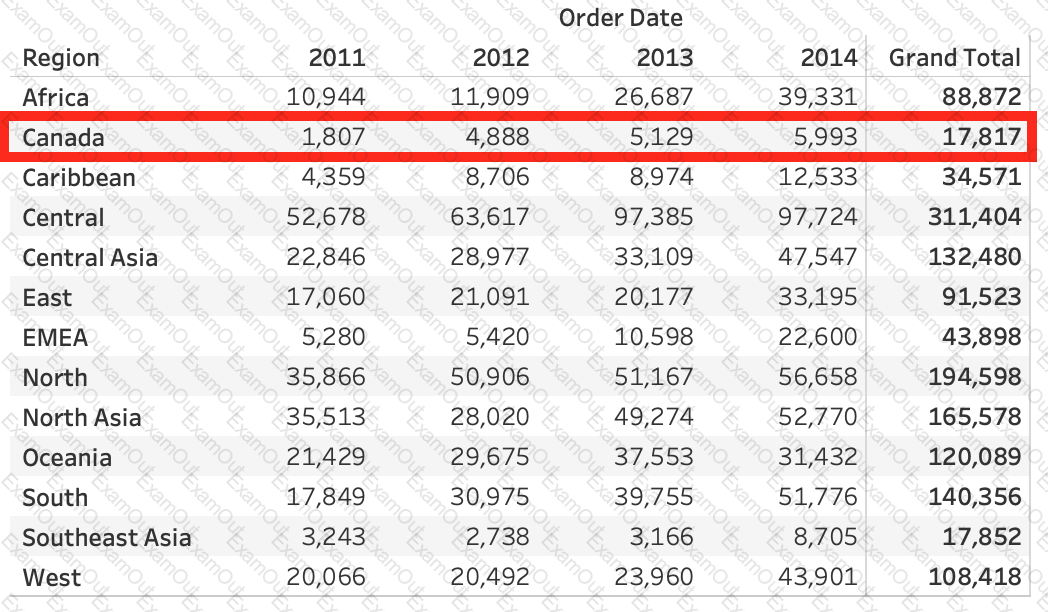
Using the dataset provided, create a crosstab showing the Profit of each Region per Year, then add grand totals to the view. What was the total Profit for Canada in 2012 and the total Profit for Canada for 2011 through 2014, respectively?
At a minimum, what do you need to create a simple scatter plot?
Creating a scatter plot requires a minimum of how many measures?
Which mark type is used in a highlight table?
Which statement accurately describes creating a group by selecting headers in a view?
What are two ways to share a dashboard as an image file? Choose two.
A field that shows average home values for the United States in 2016 is most likely :
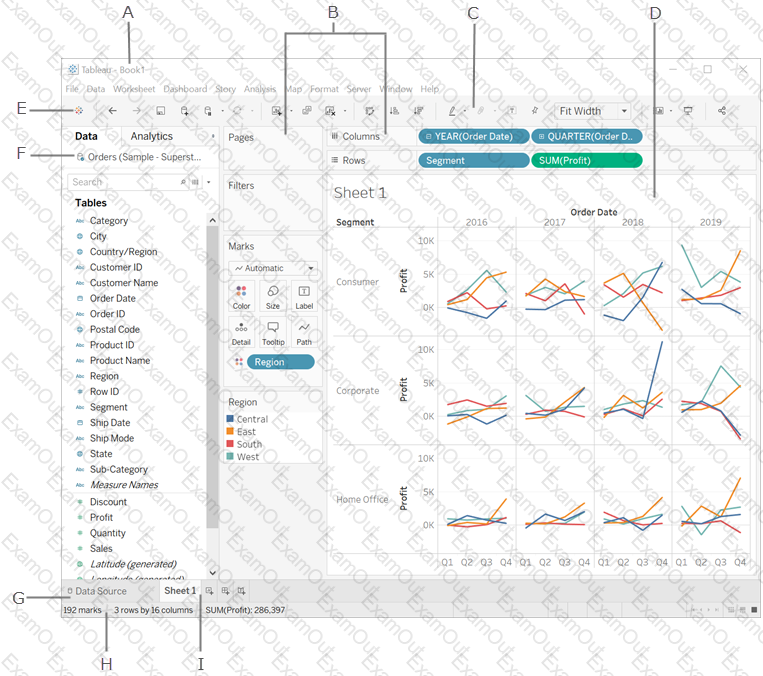
You clicked Sheet 1 from the data source page, and now you have opened the Tableau Desktop workspace as shown above. What is the main thing that you do here?
 Graphical user interface, application
Description automatically generated
Graphical user interface, application
Description automatically generatedDOWNLOAD THE DATASET FROM: https://drive.google.com/drive/folders/1WXzqsrNmXVdmQ-574wld4InEplyKT8RP?usp=sharing (if you haven't already)
Using the cwurData table, plot a Map to see which country had the Second highest number of patents in the Year 2013?
