Weekend Sale - Limited Time 70% Discount Offer - Ends in 0d 00h 00m 00s - Coupon code: sntaclus

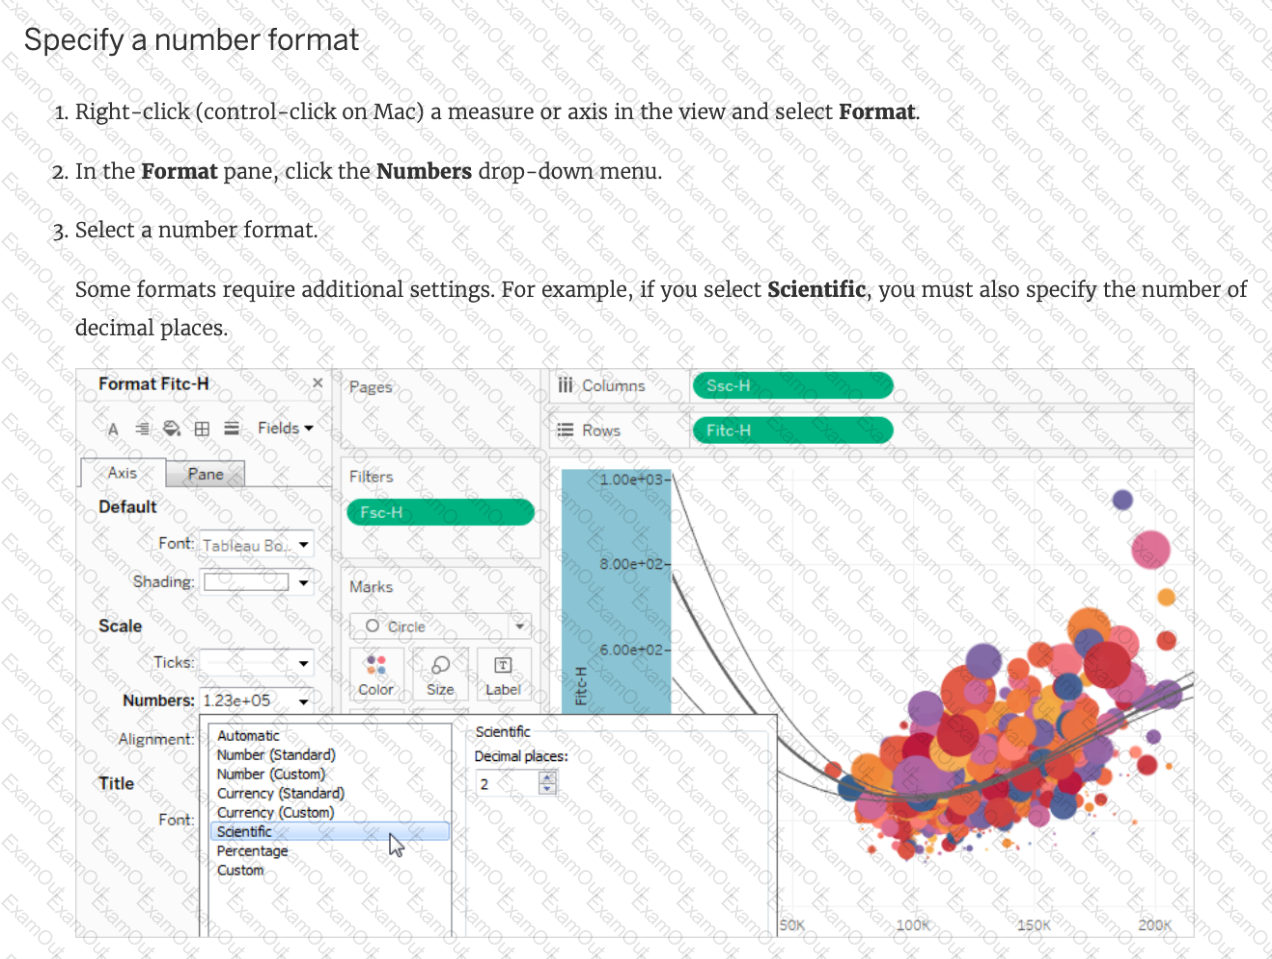
How can you format numbers in Tableau as currency?

A.

Right-click a measure or axis in the view and select Format. Then in the Format pane, click the Numbers drop-down menu.

B.

Right-click on the data source used in the view and select Format. Then in the Format pane, click the Numbers drop-down menu.

C.

Right-click a dimension in the view and select Format. Then in the Format pane, click the Numbers drop-down menu.

D.

Right-click on the Sheet name and select Format. Then in the Format pane, click the Numbers drop-down menu.

What are two use cases for a story? Choose two.

A.

Provide additional editing and interactive capabilities to your audience.

B.

Present a data narrative to lead your audience to your conclusions.

C.

Assemble a sequenced analysis to share with collaborators.

D.

To allow for easier exporting to Power Point.

If you see a Blue field, generally it will add _____________ to the view

A.

axis

B.

both

C.

none

D.

headers

The default path for all supporting files, data sources, icons, logs etc is in ______________________

A.

Documents -> Tableau Files

B.

Documents -> Tableau

C.

Documents -> My Tableau Repository

D.

Downloads -> Tableau Support Files

How can you MANUALLY assign geographic roles to a dimension from the data pane?

A.

Edit the config file in My Documents -> MyTableauRepository for a quick fix

B.

Right click it -> Geographic role -> and then assign the appropriate geographic role

C.

Edit the data source manually for a quick resolution

D.

Right click it -> Edit Default properties -> Assign geographic roles

When you want to first apply a filter and THEN show the Top N or Bottom N elements, which of the following filters would you use?

A.

Data source Filter

B.

Extract Filter

C.

Context Filter

D.

None of the these

Which of the following options best describe measures?

A.

They are categorical, qualitative

B.

They are categorical, quantitative

C.

They are numerical, qualitative

D.

They are numerical, quantitative

Skipped Join the Geo Data and Time Series Table on the Item Number ID column, and display the Store count for every State on a Map. What was the Store count in 2017 for Texas (TX)?

Join the Geo Data and Time Series Table on the Item Number ID column, and display the Store count for every State on a Map. What was the Store count in 2017 for Texas (TX)?

A.

592,593

B.

293,202

C.

416,702

D.

336,908

_______________ enables us to create workbooks and views, dashboards, and data sources in Tableau Desktop, and then publish this content to our own server.

A.

Tableau Server

B.

Tableau Prep

C.

Tableau Public

D.

Tableau myServer

What does the box in a box plot represent?

A.

Maximum value of the data

B.

Minimum value of the data

C.

The interquartile range

D.

The median of the middle half of the data points