Weekend Sale - Limited Time 70% Discount Offer - Ends in 0d 00h 00m 00s - Coupon code: sntaclus

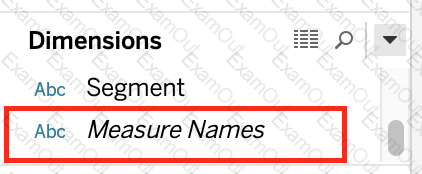
Which one of the following is a dimension?

A.

Longitude

B.

Measure Names

C.

Number of records

D.

Latitude

What should you use to apply bold text formatting to rows or columns independent of each other?

A.

Text on the Marks card

B.

The Field Format Font pane

C The Rows tab or the Columns tab on the Format Font pane

C.

The Sheets tab on the Format Font pane

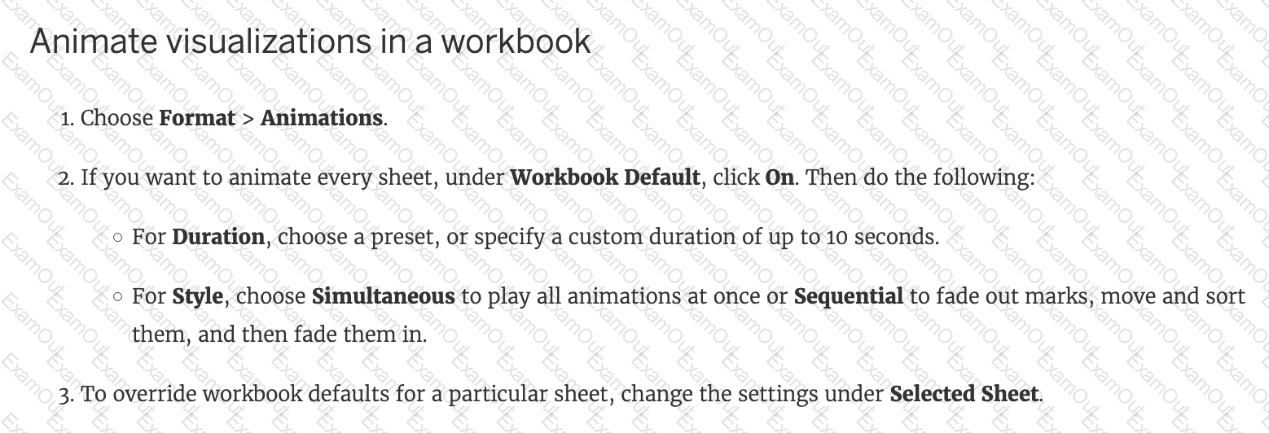
When using Animations in a Tableau, which of the following is the default duration for animations?

A.

0.4s

B.

0.3s

C.

0.5s

D.

0.2s

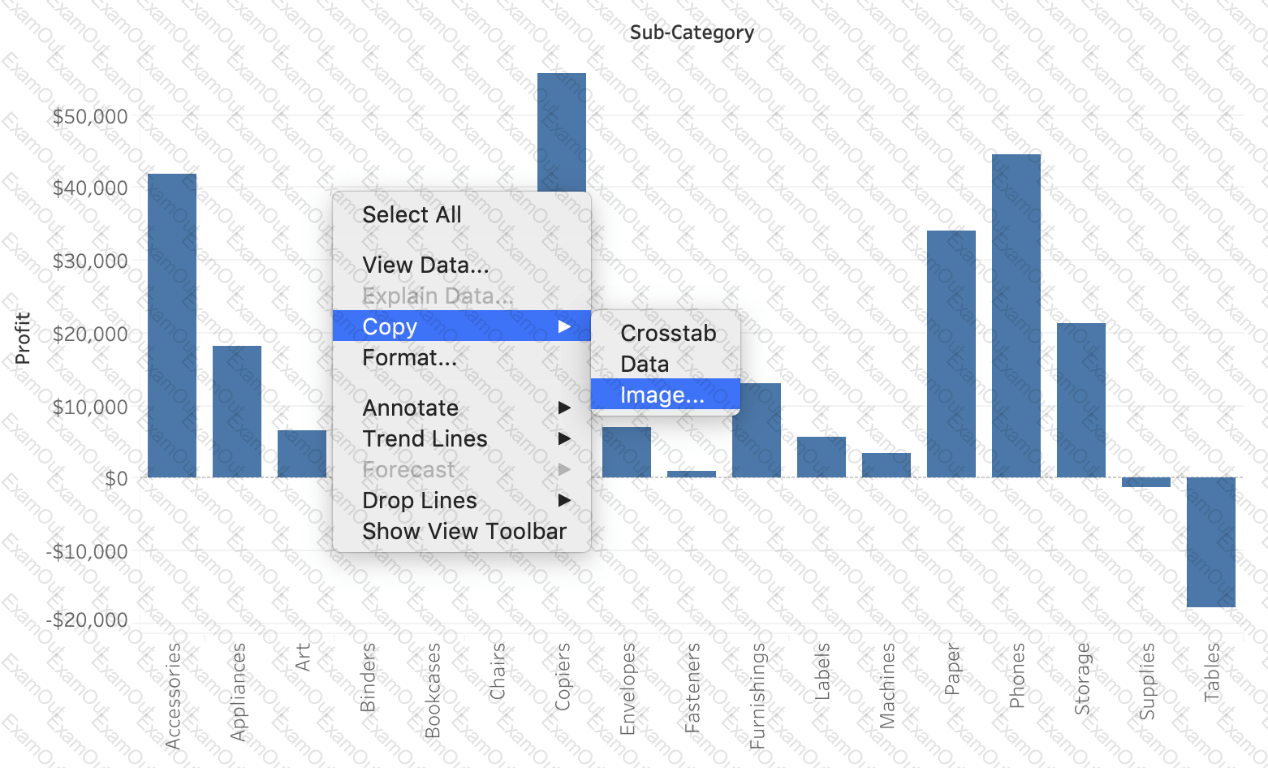
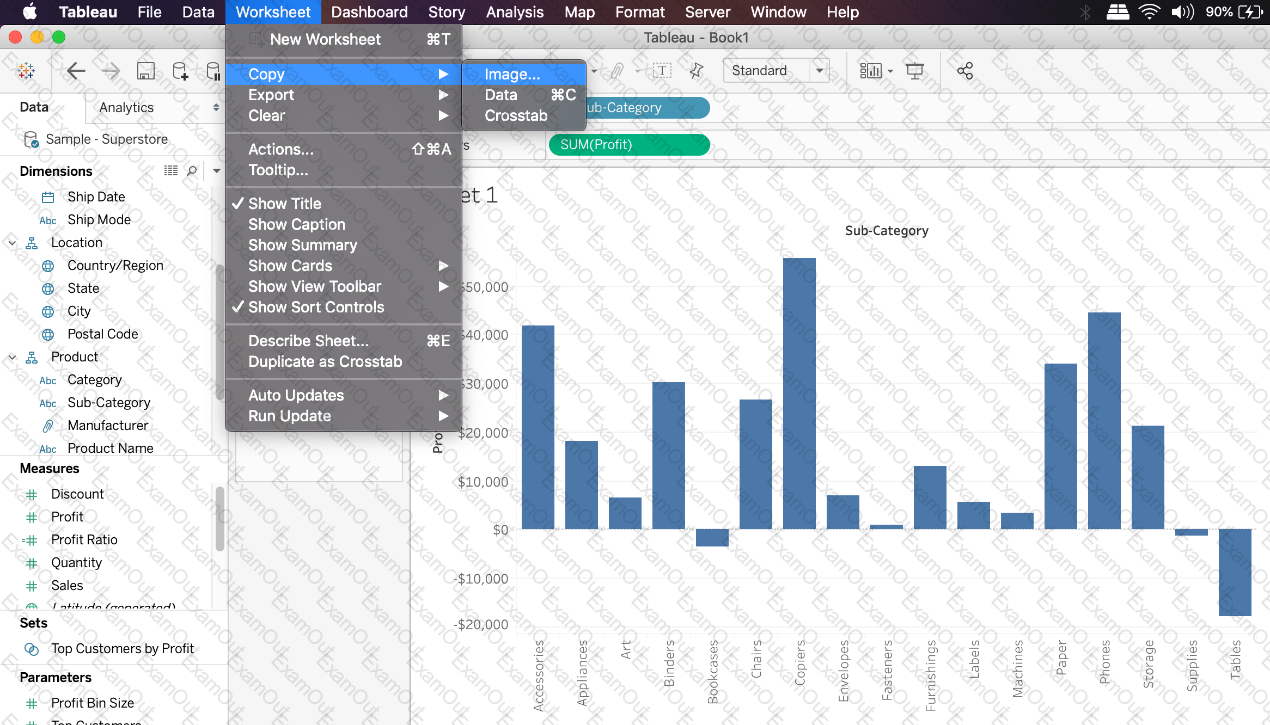
Which of the following are valid ways to copy a worksheet visualisation as an image?

A.

By simply clicking Control + V on the keyboard

B.

By clicking on Worksheet in the Tableau Main Menu above, and choosing Copy->Image

C.

Using the Marks shelf and choosing Copy->Image

D.

By right clicking on the worksheet visualisation and selecting Copy->Image

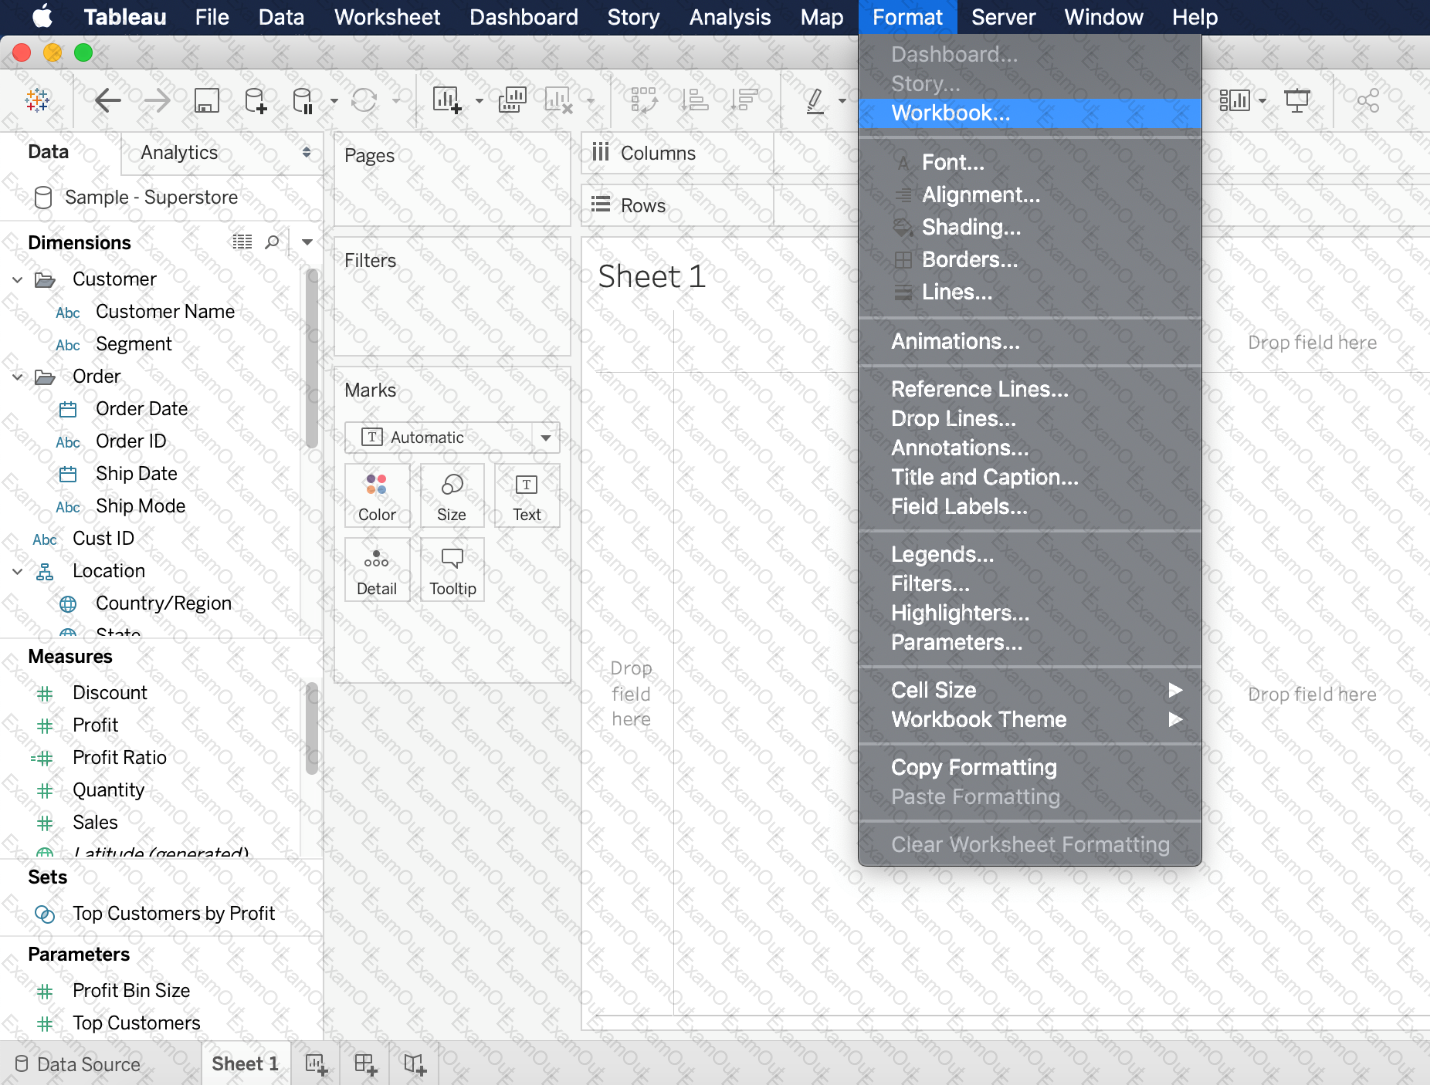
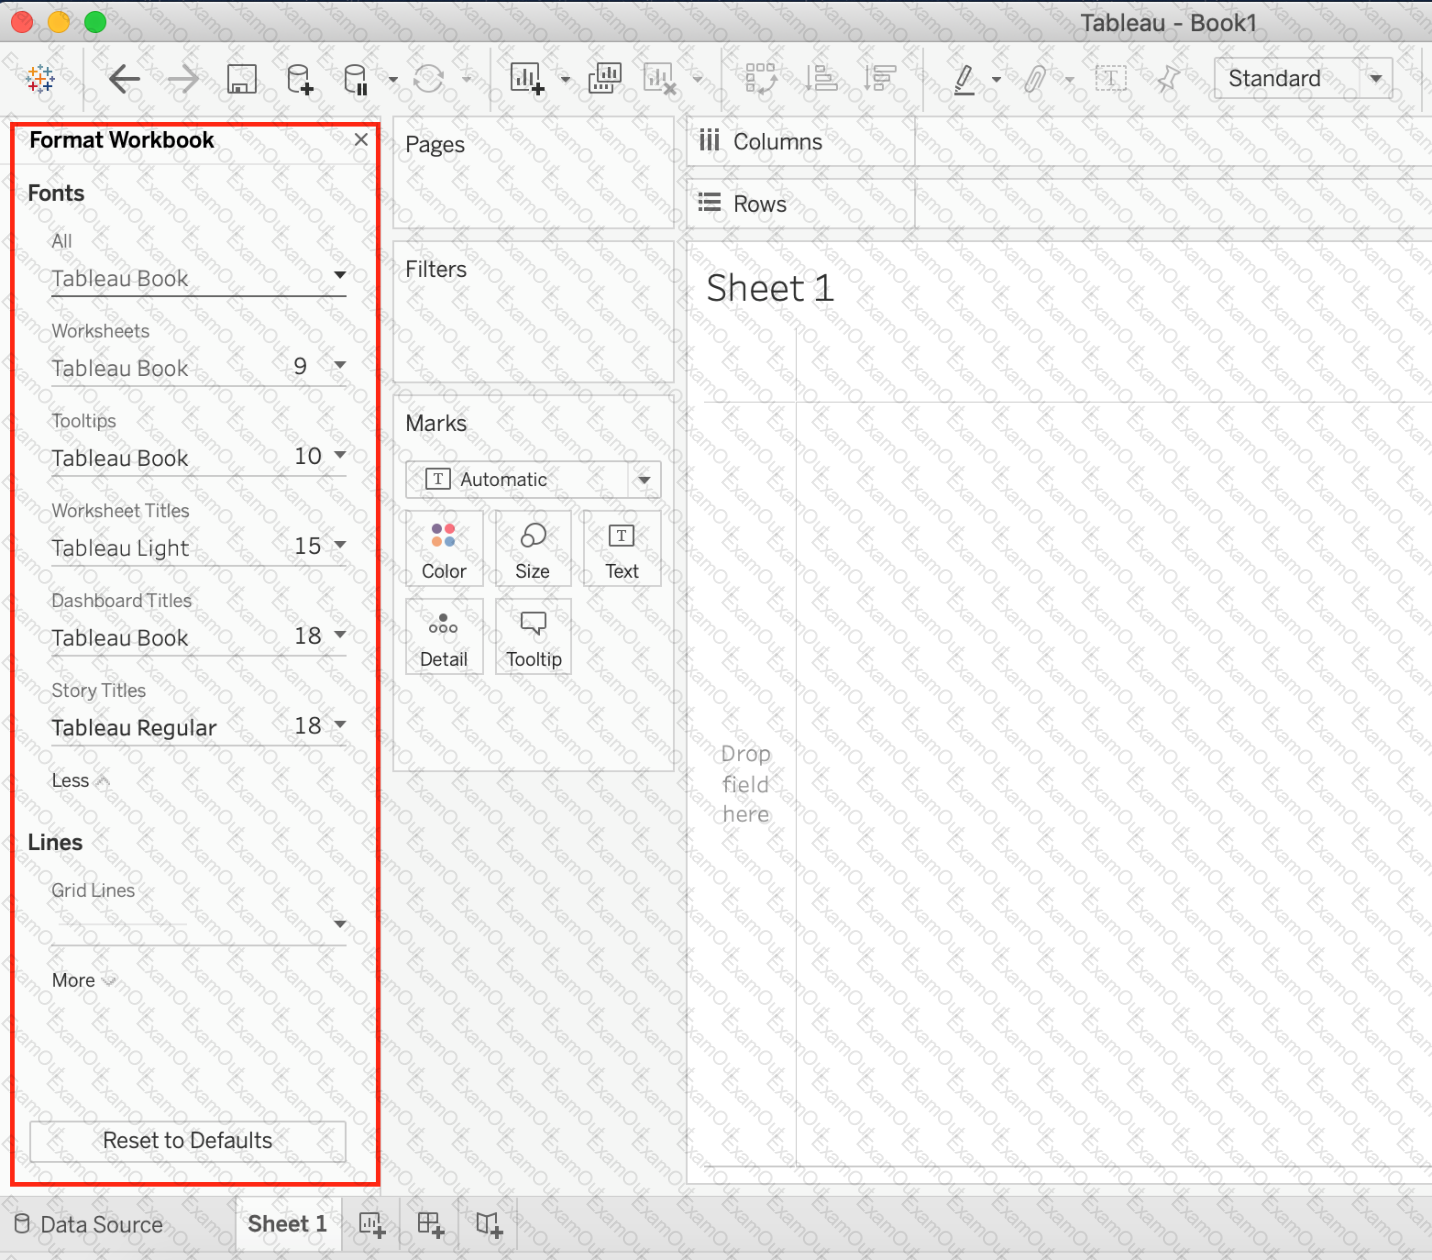
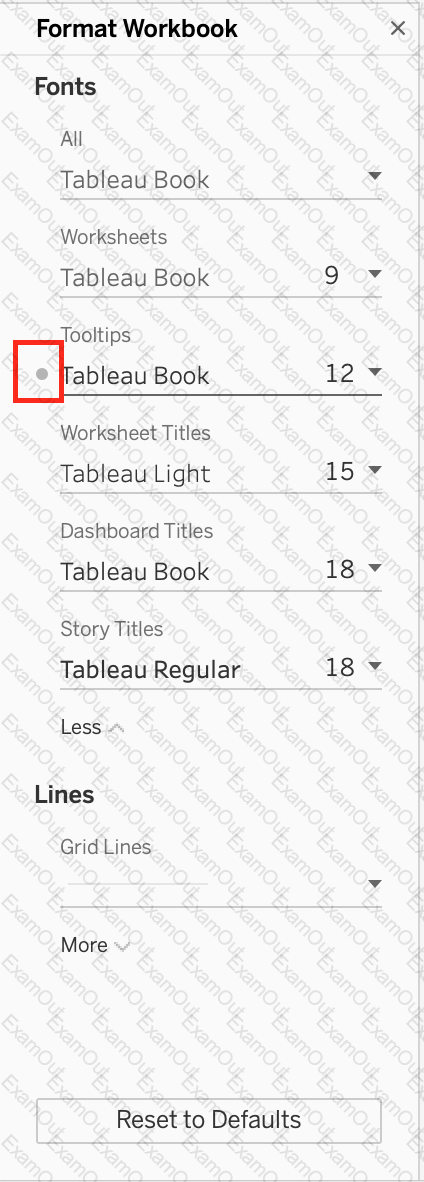
Which of the following describes the best way to change the formatting at a workbook level?

A.

Right click anywhere in the view, choose format, and then specify the

formatting in the new Format workbook pane.

B.

It is only possible to specify formatting at a worksheet level, not at the

workbook level.

C.

Click on Text in the Marks card, choose format, and then specify the

formatting in the new Format workbook pane.

D.

Choose Format from the menu on top and then specify the

formatting in the new Format workbook pane.

A dual axis chart is useful for comparing two measures that___________.

A.

have different scales

B.

have little in common

C.

are Table Calculations

D.

are aggregated Dimensions

________________ is hosted by Tableau to share our visualisations publically with the world.

A.

Tableau Reader

B.

Tableau Desktop

C.

Tableau Server

D.

Tableau Public

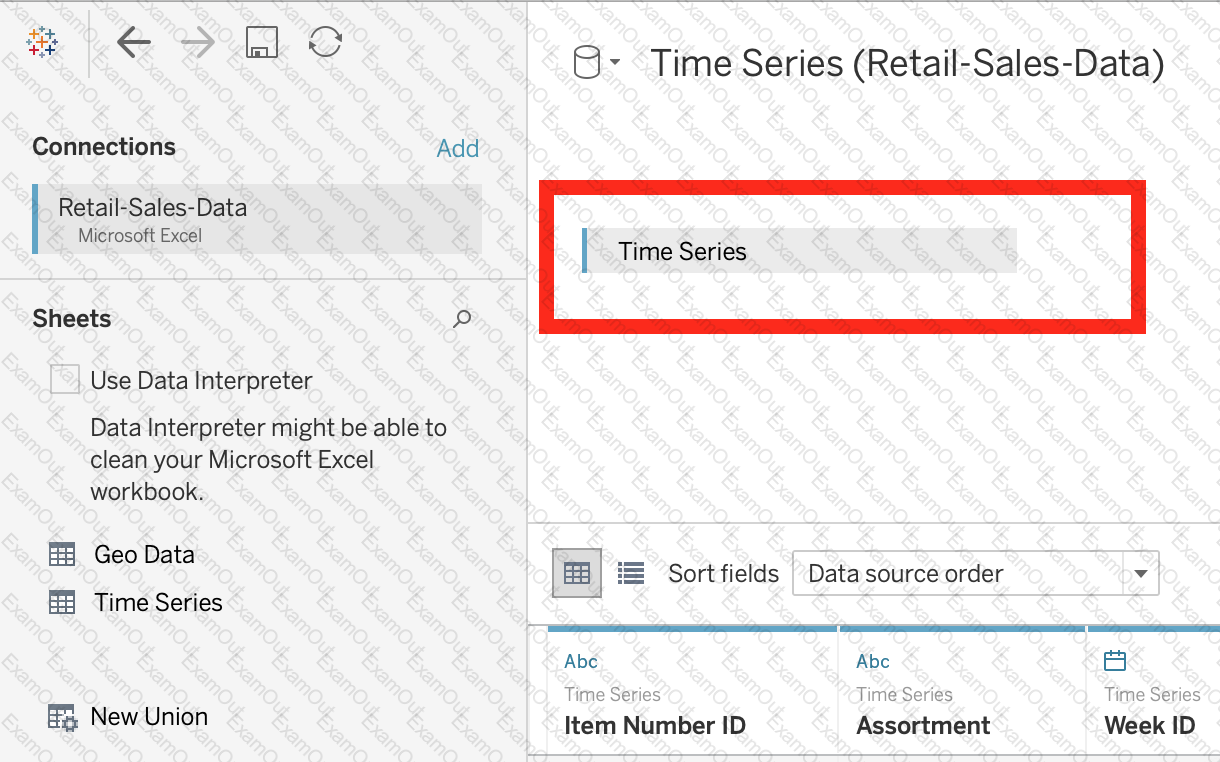
Download the Dataset from: https://drive.google.com/file/d/12AYHfiPWkwBmvH0zbumOURgUX6Az00Rw/view?usp=sharing

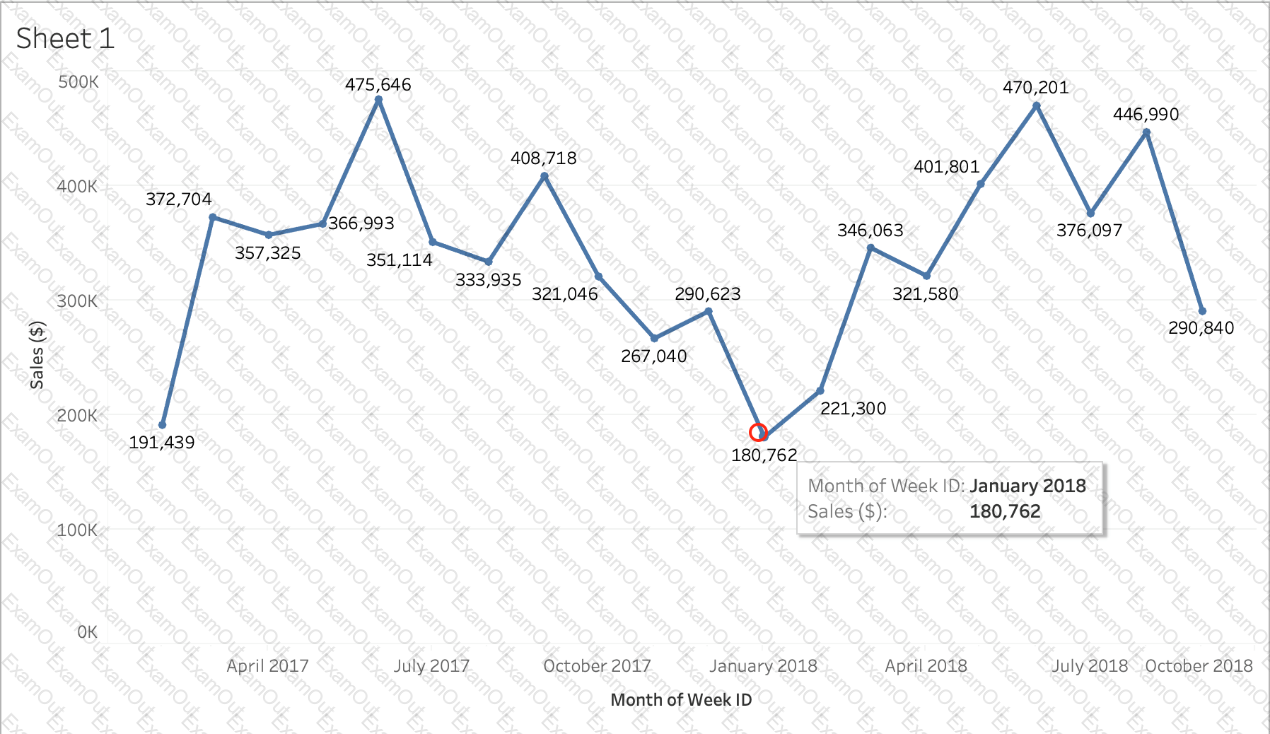
Using the Time Series Table, create a line chart to show Sales over time. Which Month and Year witnessed the lowest Sales?

A.

September 2017

B.

March 2018

C.

December 2017

D.

January 2018

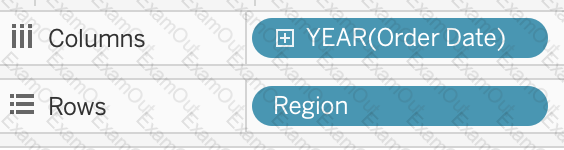
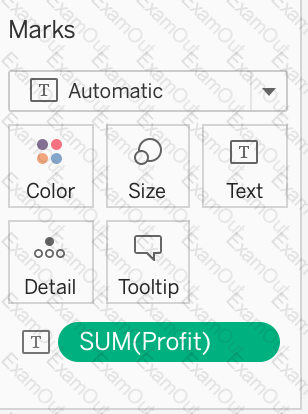
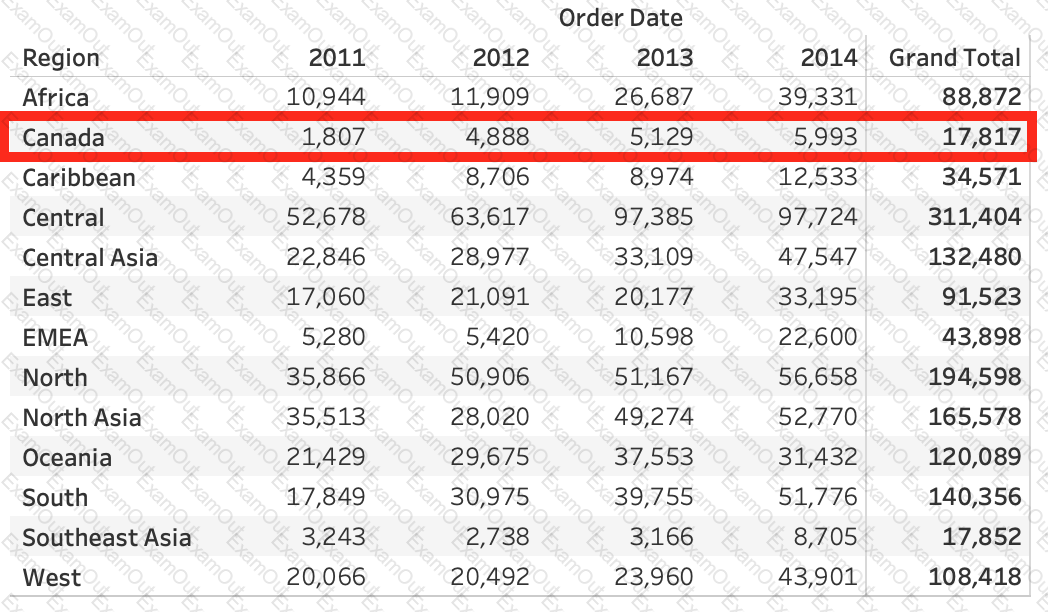
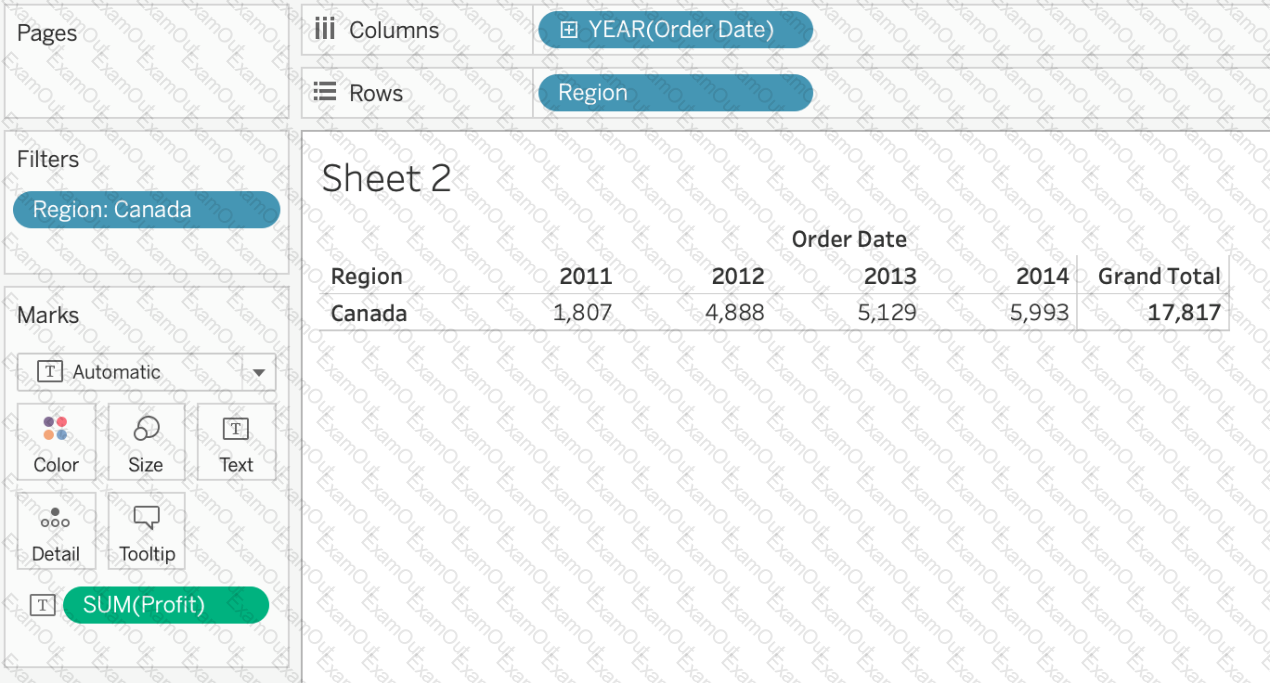
Using the dataset provided, create a crosstab showing the Profit of each Region per Year, then add grand totals to the view. What was the total Profit for Canada in 2012 and the total Profit for Canada for 2011 through 2014, respectively?

A.

5,129 and 88,872

B.

52,678 and 311,404

C.

1,807 and 34,571

D.

4,888 and 17,817

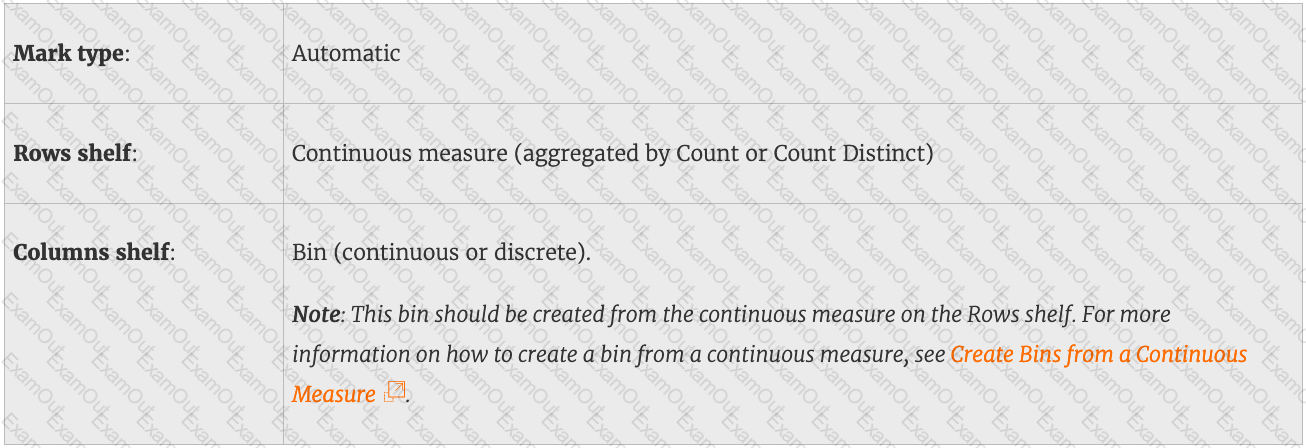
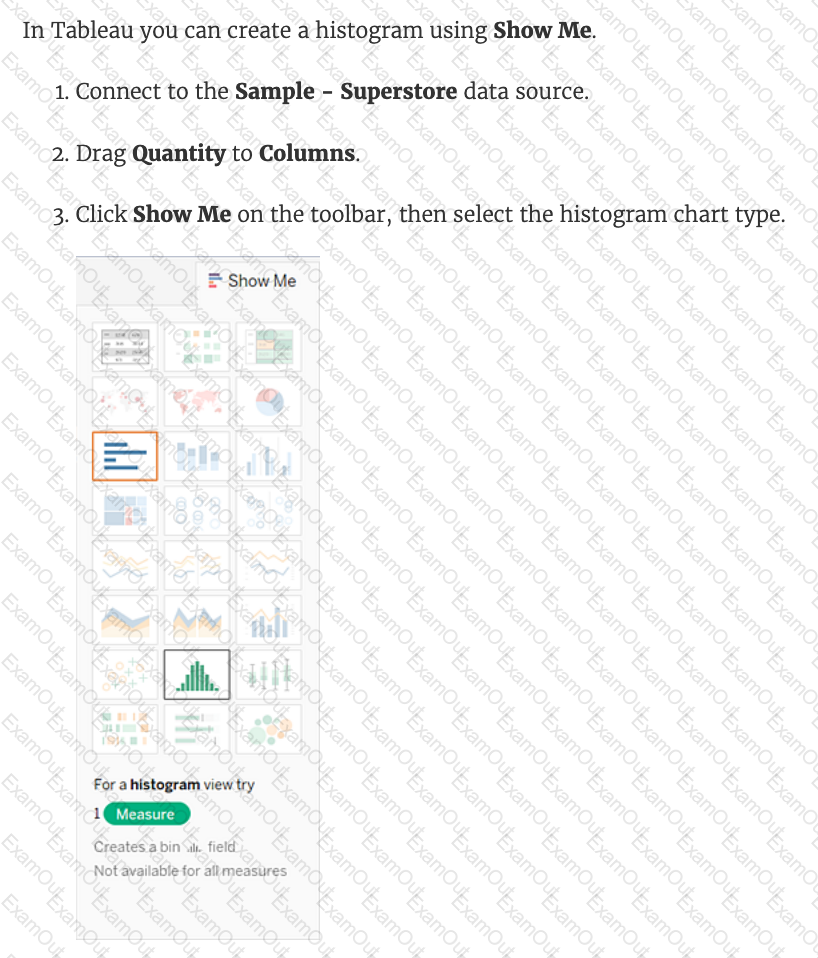
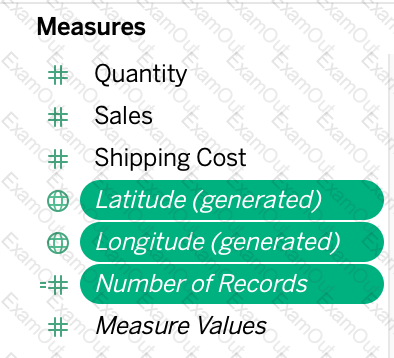
Which of the following can you use to create a Histogram?

A.

2 measures

B.

1 measure

C.

2 dimensions

D.

1 dimension