Which of the following statements about adding properties to MTS are true? (select all that apply)
When installing OpenTelemetry Collector, which error message is indicative that there is a misconfigured realm or access token?
Which component of the OpenTelemetry Collector allows for the modification of metadata?
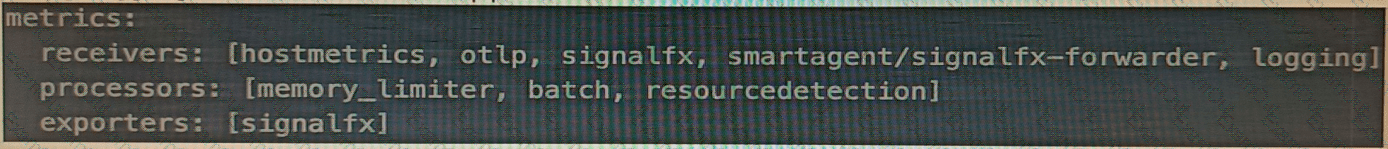
A customer is experiencing issues getting metrics from a new receiver they have configured in the OpenTelemetry Collector. How would the customer go about troubleshooting further with the logging exporter?
Adding debug into the metrics receiver pipeline:

Adding logging into the metrics receiver pipeline:
Adding logging into the metrics exporter pipeline:

Adding debug into the metrics exporter pipeline:

What is one reason a user of Splunk Observability Cloud would want to subscribe to an alert?
How is it possible to create a dashboard group that no one else can edit?
A customer has a large population of servers. They want to identify the servers where utilization has increased the most since last week. Which analytics function is needed to achieve this?
