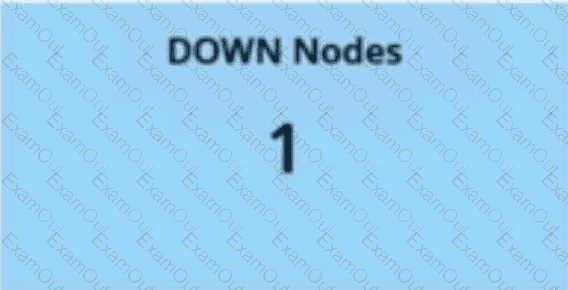
According to theSolarWinds Platform Administrator GuideregardingModern Dashboards, the platform introduces several new widget types designed for high-performance data visualization. The widget shown in the image, which displays a single, large numerical value (the number "1") representing a specific count of "DOWN Nodes" against a distinct colored background, is officially categorized as aKPI (Key Performance Indicator)widget.
KPI widgets are specifically engineered to provide an immediate "at-a-glance" understanding of critical metrics. Unlike the legacy "Classic" dashboards which relied on multi-row tables or fixed gauges, the Modern Dashboard KPI widget allows for a highly streamlined presentation of data derived fromSWQL (SolarWinds Query Language). In this instance, the widget is likely running a query such as SELECT count(NodeID) FROM Orion.Nodes WHERE Status = 2, which returns a single scalar value. This value is then rendered prominently in the center of the widget.
One of the defining features of the KPI widget in HCO is its ability to useConditional Formatting. This allows the background color of the widget to change dynamically based on the value returned by the query; for example, the background may turn red if the count of down nodes is greater than zero, providing a visual alert to the NOC staff. This type of widget is distinct from a "table" (D), which displays multiple rows of data, or a "counter" (A), which is typically a legacy term for simple incremental statistics. It is also not a "custom HTML" (B) widget, as those are used for embedding external content or custom code rather than native data point visualization. The KPI widget remains the primary tool for displaying high-level summary statistics, such as active alert counts, total interface errors, or, as seen here, the availability status of nodes across the environment.


