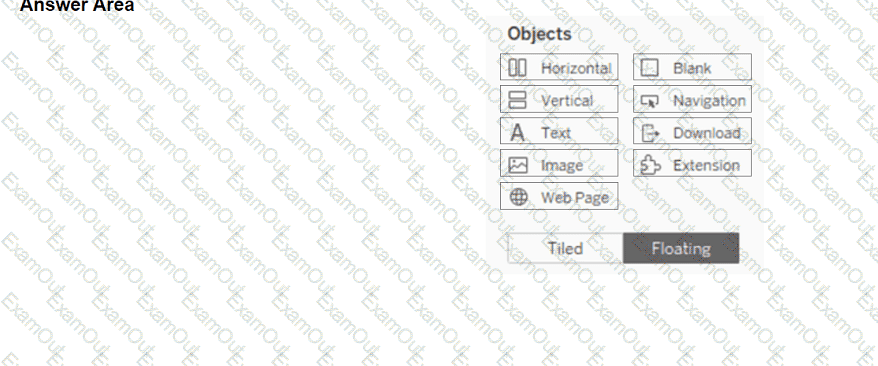
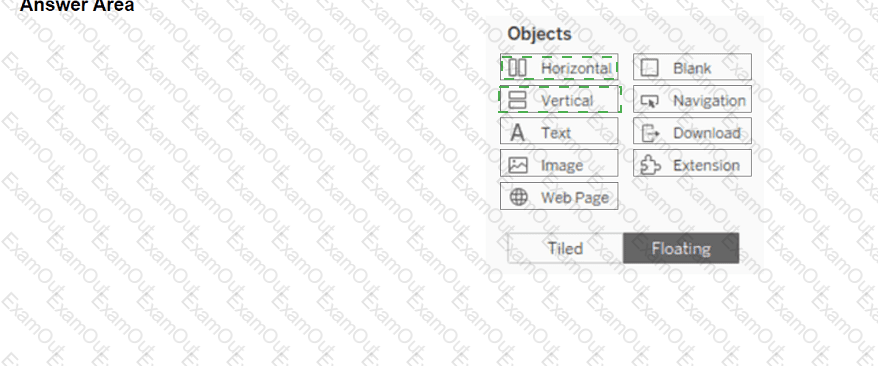
You have a blank dashboard.
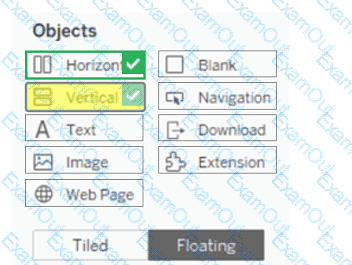
You want to add two sheets to the dashboard. The sheets must support the Show/Hide button.
To which two objects can you add the sheets? (Click the two appropriate Options in the Answer Area.)
You have a database that includes field named sales, City and Region.
You have the following chart that shows the number of sales made in different cities.
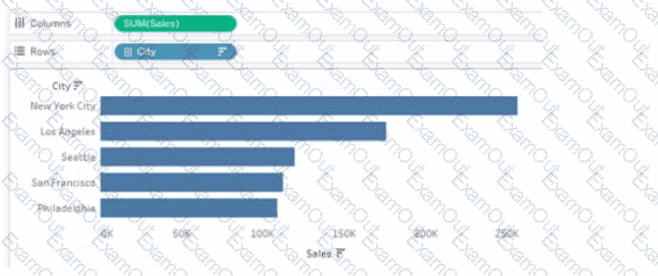
You want to dynamically show the corresponding region when users hover their mouse over any of the bars.
What should you do?
You have the following visualization.
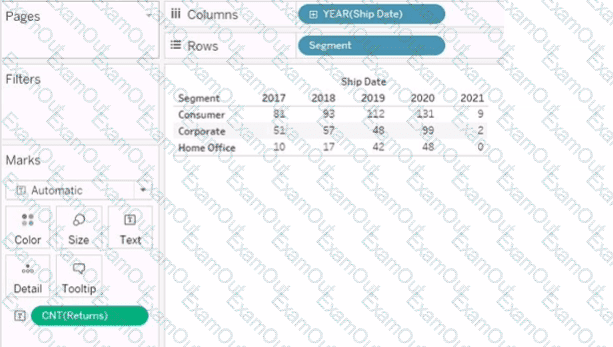
You want the count of Returns displayed only for the first year in the table.
How should you complete the formula in the calculated field? (Use the dropdowns in the Answer Area to select the correct options to complete the formula.)


You have the following tiled dashboard that has one sheet.
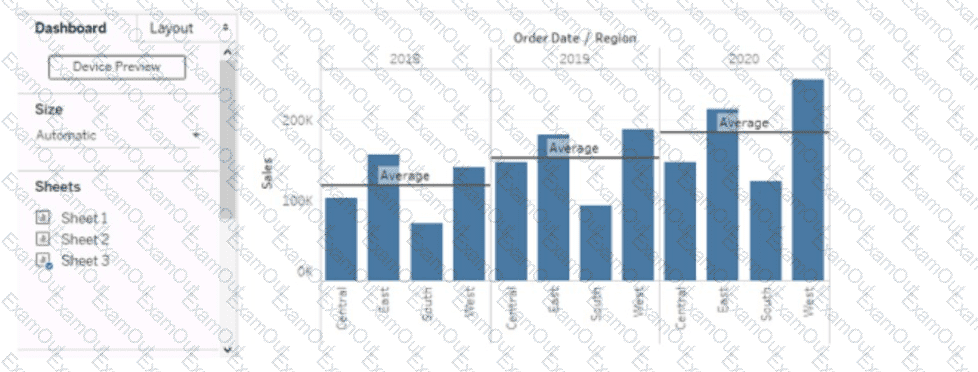
You want to replace the sheet with Sheet2.
What should you do?
A Data Analyst is building a dashboard and wants to allow users to select which measure is being shown on one of the charts.
Which type of action should the analyst use to accomplish this?
You create the following story that contains two story point.
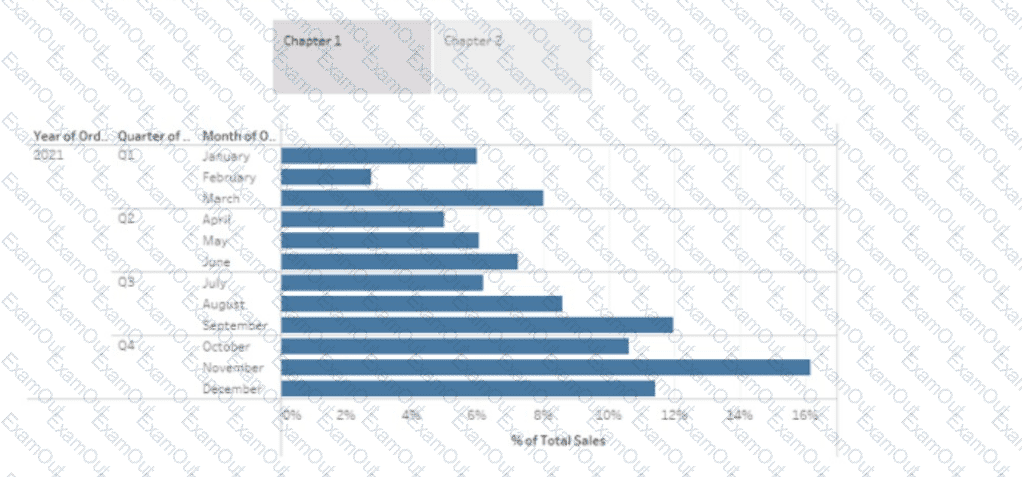
You want to change the story point format to show the current story point number out of the total number of story points.
Which Layout option should you use?
You have the following dataset.

You need to generate the results in the Day field.
How should you complete the formula? (Use the dropdowns in the Answer Area to select the correct options to complete the formula.)


How should a Data Analyst sort data by Sales across multiple dimensions in Tableau?
You have the following two tables.
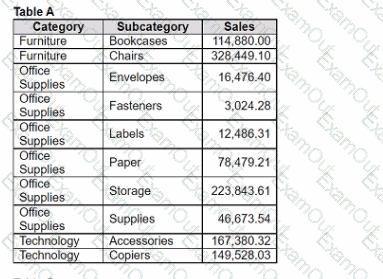
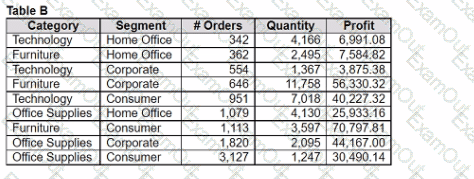
Table A is the primary table.
Which type of join is established when a blend is created by using the join key of Category?
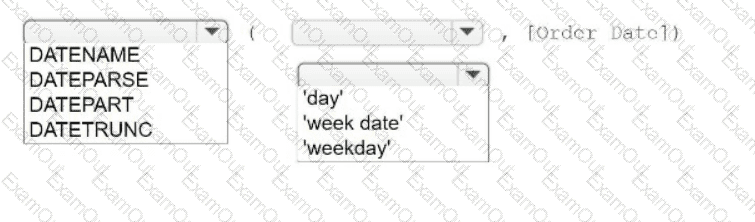
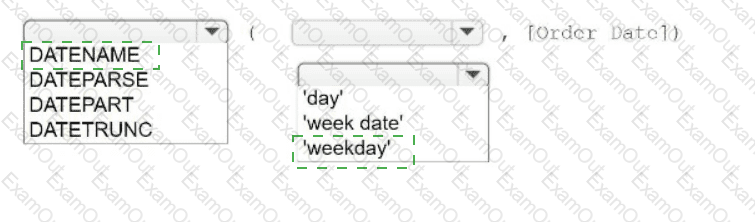
You have a table that contains four columns named Order Date, Country, Sales, and Profit.
You need to add a column that shows the day of the week for each row. For example, orders placed on August 31, 2022, will show a day of
Wednesday.
How should you complete the formula? (Use the dropdowns in the Answer Area to select the correct options to complete the formula.)