Weekend Sale - Limited Time 70% Discount Offer - Ends in 0d 00h 00m 00s - Coupon code: sntaclus

JIDA automatically collects metrics from predefined categories of classes except:

A.

EJBs: classes that implement the javax.ejb.EntityBean or javax.ejb.SessionBean interfaces

B.

JDBC - classes that implement any of several interfaces in the java.sql package

C.

JNDI - classes that implement the javax.naming.Context or javax/naming/directory/DirContext interfaces

D.

Portlets - classes that implement the javax.portlet.Portlet interface

E.

Generic classes

What issues arise in instrumenting a Java application using IBM SDK Java when the command line to start the application is not readily accessible? (Select 2)

A.

Some code compilation or modification is needed.

B.

You can set the IBM_JAVA_OPTIONS environment variable to add the argument into the application startup.

C.

IBM SDK Java is not supported.

D.

Setting the IBM_JAVA_OPTIONS environment variable will add the same argument into every IBM SDK Java application startup.

When investigating reports of web page performance problems, which of these integration pathways could be used? (Select 3)

A.

RPM Dashboards -> AppResponse Xpert -> AppInternals Xpert -> Transaction Trace Warehouse

B.

BrowserMetrix -> AppTransaction Xpert

C.

Transaction Trace Warehouse -> AppInternals Xpert -> AppResponse Xpert -> AppTransaction Xpert

D.

RPM Dashboards -> BrowserMetrix -> Transaction Trace Warehouse

E.

RPM Dashboards -> AppInternals Xpert -> AppTransaction Xpert

Refer to the exhibit.

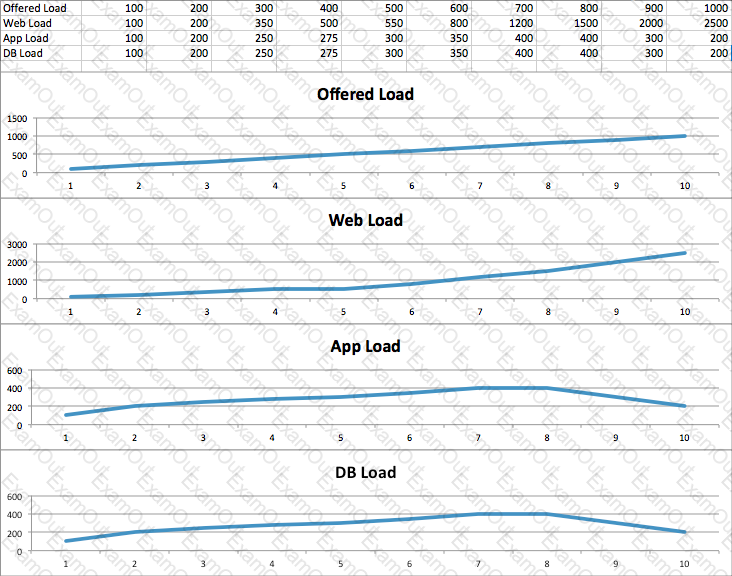
This graph represents the number of requests waiting for a response across various tiers. With load being generated at a constantly increasing rate, which tier is the bottleneck and why?

A.

The Web tier is the bottleneck because it has the most open requests waiting for a response.

B.

The DB tier is the bottleneck because it is the lowest tier that is clearly not handling requests in time.

C.

The App tier is the bottleneck because it is the first tier not handling the same number of requests as the tier above it.

D.

The Web tier is the bottleneck because at an Offered Load of 300, there are still 50 requests waiting from the Web tier, and it never recovers. The lower tiers do not get the requests passed to them because the Web tier is not processing fast enough.

E.

The App tier is the bottleneck because the DB tier is handling everything the App tier sends it.

After downloading Web Transaction Analysis page view packets from AppResponse Xpert and opening AppTransaction Xpert, you are prompted to enter Transaction Trace Warehouse information. Why did the prompt appear and what does it mean?

A.

The prompt always appears when you use this workflow. It means AppResponse Xpert passed a parameter to AppTransaction Xpert, causing it to search the specified Transaction Trace Warehouse server for supporting server trace information.

B.

The AppTransaction Xpert preferences were set to always import Transaction Trace Warehouse trace data no matter how the packets were obtained.

C.

While importing the packets, AppTransaction Xpert noticed HTTP headers indicating the presence of transaction tracing. It is asking for the hostname and credentials of the appropriate Transaction Trace Warehouse server to download the specific transaction traces referenced in the HTTP headers of the packet trace.

D.

When the AppInternals Xpert instrumentation is set to create trace files, it marks the TCP headers for each packet in that transaction so AppTransaction Xpert knows to look for supporting transaction data.

Refer to the exhibit.

In the diagram, what does the WIN<<7=17408 (in the red rectangle) indicate?

A.

TCP window scaling

B.

Maximum transmission unit (MTU)

C.

TCP maximum segment size

D.

Packet size

In a three-tier application with a web front-end, application middle tier, and database back-end, where is the best instrumentation point for end-to-end visibility?

A.

It is best to instrument at all tiers for maximum visibility.

B.

It is best to instrument at the web tier, since that is typically the client entry point into the application.

C.

It is best to instrument at the application tier, since it sits between the web and database tiers.

D.

It is best to instrument at the database tier, since it holds the data the client is requesting.

For a seamless workflow that spans monitoring, alerts, triage, and diagnosis of root causes, the best overall solution is:

A.

AppResponse Xpert

B.

AppTransaction Xpert

C.

AppInternals Xpert

D.

AppSensor Xpert

Which of the following applies when comparing AppInternals Xpert metric data with AppResponse Xpert data for the last 10 minutes?

A.

Both provide average data, but AppInternals Xpert has data at 1-second granularity while AppResponse Xpert has data at 1-minute granularity.

B.

Measuring common requests, AppResponse Xpert data provides network and server processing delay while AppInternals Xpert provides server processing delay only.

C.

Assuming response time is being evaluated for a common request available from both data sources, AppInternals Xpert data is the maximum response during each 1-second bucket while AppResponse Xpert data is averaged over a 1-minute bucket.

D.

AppInternals Xpert "Max. Active" metrics on Servlet/JSP/Web Aggregate metrics should exactly match AppResponse Xpert "Connections" metric.

How can dashboards be shared? (Select 2)

A.

By having many people log in with the same account

B.

By clicking on the Link tool to create a unique URL for the dashboard

C.

By exporting the dashboard as a report