A company has recently implemented Qlik Sense. A user is looking to use natural language questions to help create content. Which feature can achieve this goal?
A business analyst is developing an app that contains a data model with fields: Country, City, Sales, ProductName, and ProductCategory. The global sales manager wants to add new visualizations to this app.
The business analyst must include the following:
• Ability to dynamically change the number of countries and cities
• Display a maximum of 10 countries
• Display a maximum of 5 cities per country
Which steps should the business analyst take?
The CEO has requested a dashboard that tracks the company's performance. The main requirements for the dashboard:
• Minimal number of visualizations or objects
• Display multiple key measures
• Ability to easily navigate to other sheets
Which features would meet the requirements?
A business analyst needs to rapidly prototype an application design for a prospective customer. The only dataset provided by the customer contains 30 fields, but has over one billion rows. It will take too long to keep loading in its entirety while the analyst develops the data model.
Which action should the business analyst complete in the Data manager?
A business analyst has access to all of a company's data for the past 10 years. The source table consists of the following fields: TransactionID, TransactionTime, Transaction Date, Transaction Year, Cardholder, Cardholder address, Cardissuer, and Amount.
Users request to create an app based on this source with the following requirements:
•Users only review the data for the past 2 years
•Data must be updated daily
•Users should not view cardholder info
Which steps should the business analyst complete to improve the app performance?
Exhibit.
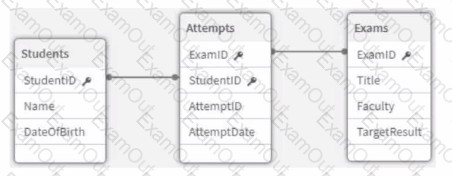
Refer to the exhibit.
An app is being developed at a university to monitor student exam attempts- Three core tables are loaded into the app for Students, Exams, and Attempts. Students can attempt the same exam multiple times.
Before building any visualizations, the business analyst needs to know:
• How many students are in the system
• What percentage of students have not yet attempted an exam
Which metadata should the analyst focus on to answer these questions?
Refer to the exhibit.
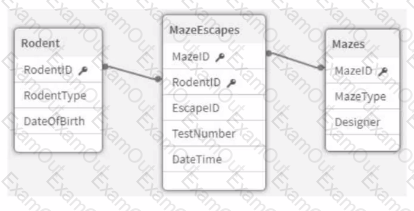
An app that will track experiments for rodents (e.g., rats and mice) that navigate mazes (labyrinths) is being developed. Individual rodents are catalogued in the Rodent table, while the Mazes table has metadata for the mazes. The MazeEscapes table holds a record of each attempt at a maze by a rodent. A business analyst needs to build a KPI that will allow users to see how many rodents have made at least one attempt at any maze.
How should the analyst construct the KPI?
A banking organization needs a dashboard that shows the following:
• A KPI indicator for current year (CY) versus last year (LY) revenue
• A scatter plot that shows the cost versus revenue of product categories
• A treemap that shows average customer satisfaction rating based on regions
• A table that shows CY cost by record number, financial instrument, and bank
In addition to the customer satisfaction rating, which fields should be used to create the required measures?
A business analyst is creating an app that contains a bar chart showing the top-selling product categories. The users must be able to control the number of product categories shown.
Which action should the business analyst take?
A dashboard developer finishes creating a supply chain analysis app and is presenting it to leadership for review. The landing page shows four visualizations including:
• Bar chart showing available supply by product category
• Line chart showing total cost of deliveries to the warehouse by month-year
• Scatter plot showing cost of delivery and time-to-deliver by product
• A map that shows the volume of delivery from suppliers to warehouses using a line layer
Leadership asks the developer how they can see the total cost of delivery overall. How can the analyst show this information to leadership?
