In the Power BI service, you create an app workplace that contains several dashboards.
You need to provide a user named user1@contoso.com with the ability to edit and publish dashboards.
What should you do?
You have a Power B1 dataset named Finance that is hosted in a Power B1 workspace.
The finance team at your company is NOT currently a member of any Power B1 workspace roles.
You need to enable the finance team to use Microsoft Excel to analyze the Finance dataset.
What should you do?
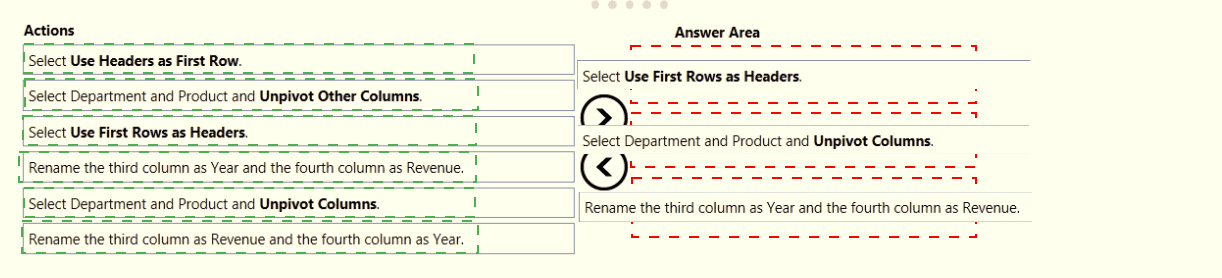
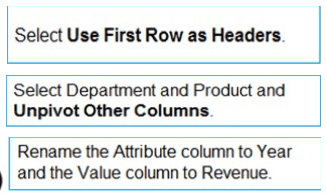
You receive revenue data that must be included in Microsoft Power Bl reports.
You perform an initial load of the data from a Microsoft Excel source as shown in the following exhibit.
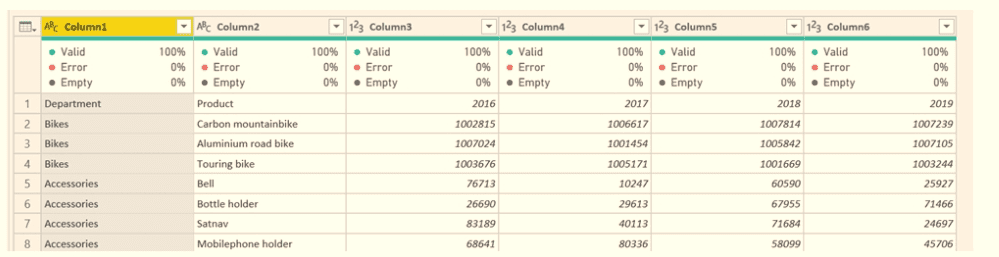
You plan to create several visuals from the data, including a visual that shows revenue split by year and product.
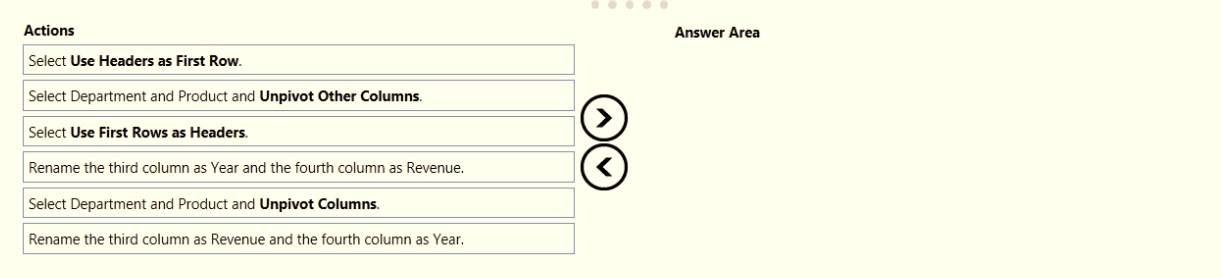
You need to transform the data to ensure that you can build the visuals. The solution must ensure that the columns are named appropriately for the data that they contain.
Which three actions should you perform in sequence? To answer, move the appropriate actions from the list of actions to the answer area and arrange them in the correct order.
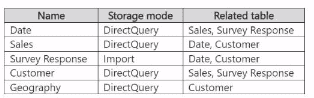
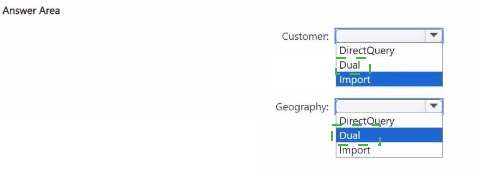
You have a Fabric tenant that hosts the semantic models shown in the following table.
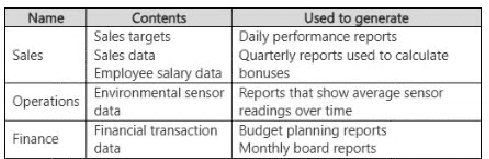
You have the following requirements:
The export of reports that contain Personally Identifiable Information (PII) must be prevented.
Data used for financial decisions must be reviewed and approved before use.
For each of the following statements, select Yes if the statement is true. Otherwise, select No.
NOTE: Each correct selection is worth one point.


You have a Microsoft Power BI data model that contains three tables named Orders, Date, and City. There is a one-to-many relationship between Date and Orders and between City and Orders.
The model contains two row-level security (RLS) roles named Role1 and Role2. Role1 contains the following filter.
City[State Province] = "Kentucky"
Role2 contains the following filter.
Date[Calendar Year] = 2020
If a user is a member of both Role1 and Role2, what data will they see in a report that uses the model?
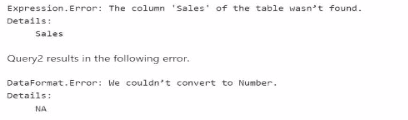
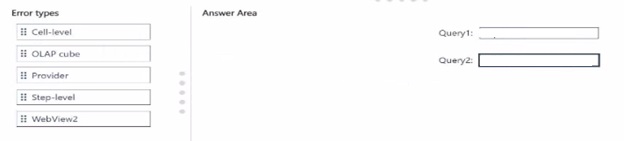
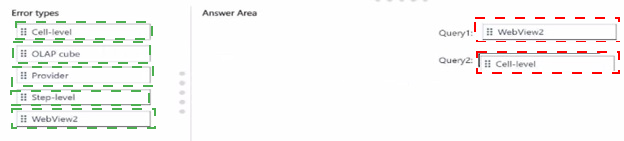
You use Power Query Editor to load two queries named Query 1 and Query2 Query1 results in the following error.
You are creating a report in Power BI Desktop.
You load a data extract that includes a free text field named coll.
You need to analyze the frequency distribution of the string lengths in col1. The solution must not affect the size of the model.
What should you do?
Note: This question is part of a series of questions that present the same scenario. Each question in the series contains a unique solution that might meet the stated goals. Some question sets might have more than one correct solution, while others might not have a correct solution.
After you answer a question in this section, you will NOT be able to return to it. As a result, these questions will not appear in the review screen.
You create a parameter named DataSourceExcel that holds the file name and location of a Microsoft Excel data source.
You need to update the query to reference the parameter instead of multiple hard-coded copies of the location within each query definition.
Solution: You modify the source step of the queries to use DataSourceExcel as the file path.
Does this meet the goal?
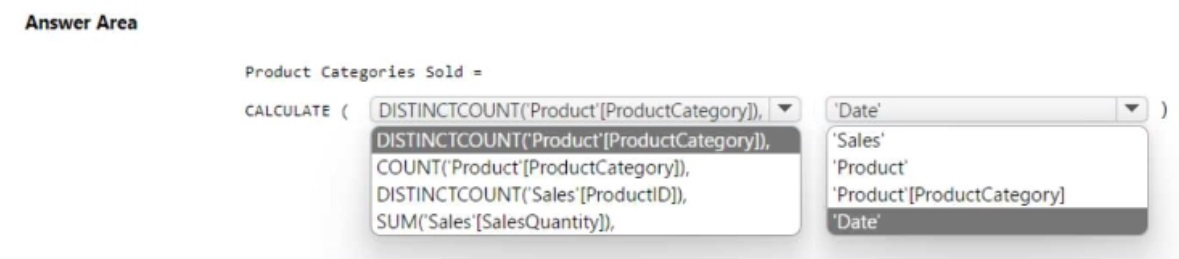
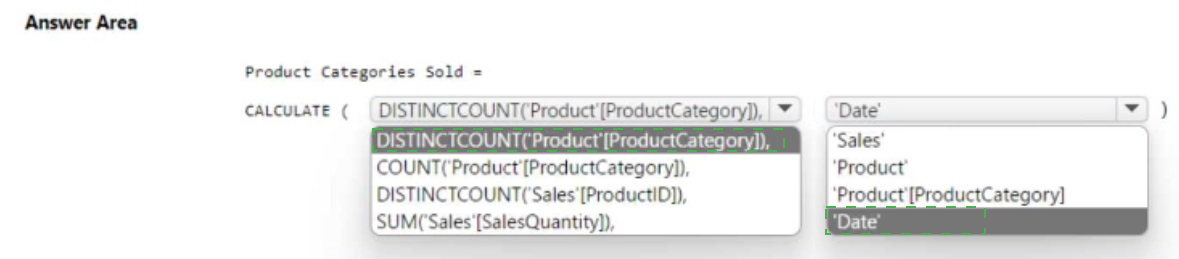
You have the Power Bl data model shown in the following exhibit.
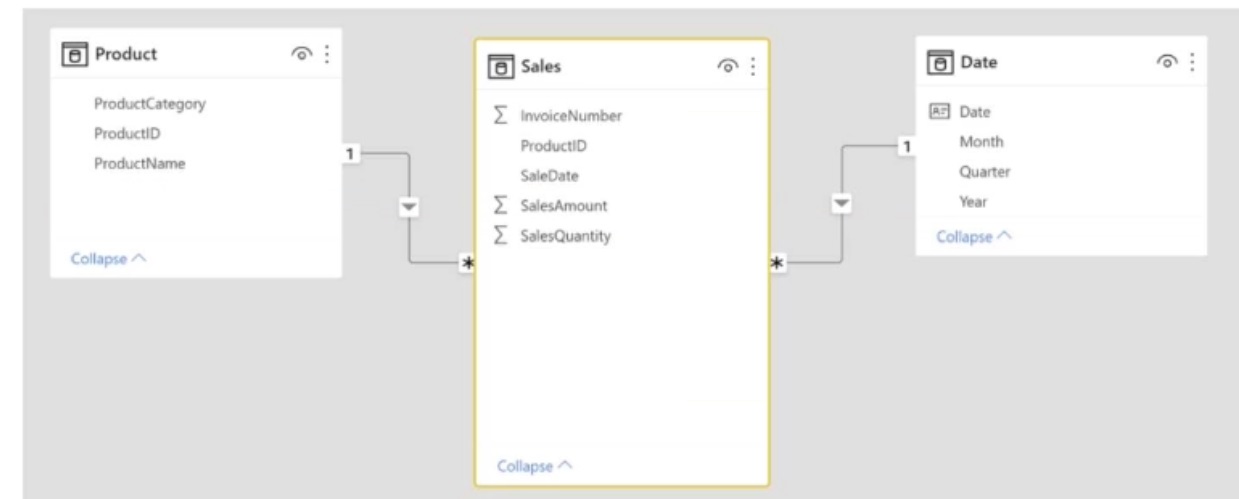
You need to create a measure to count the number of product categories that had products sold during a selected period. How should you complete the DAX expression? To answer, select the appropriate options in the answer area. NOTE: Each correct selection is worth one point.
You have a Power B1 semantic model that contains the following tables.