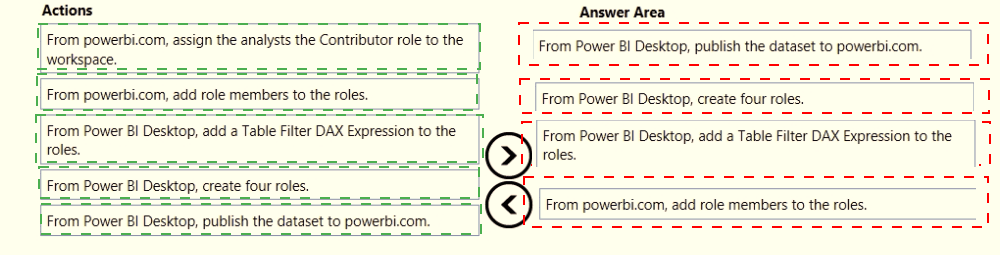
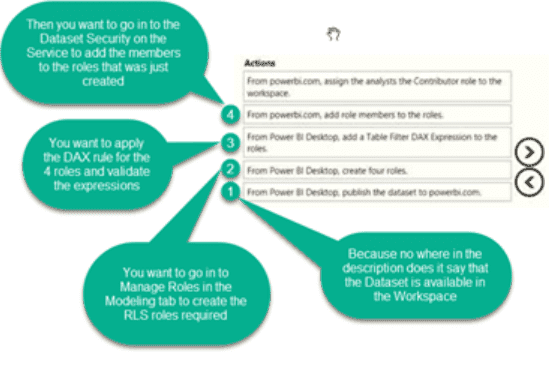
Once the profit and loss dataset is created, which four actions should you perform in sequence to ensure that the business unit analysts see the appropriate profit and loss data? To answer, move the appropriate actions from the list of actions to the answer area and arrange them in the correct order.

What is the minimum number of datasets and storage modes required to support the reports?
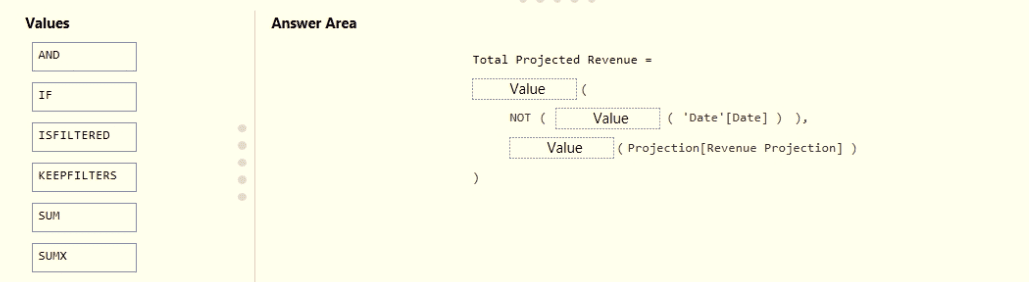
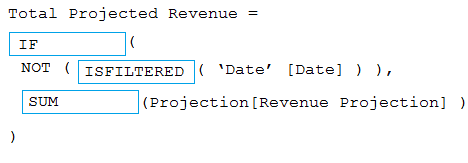
You need to create a DAX measure in the data model that only allows users to see projections at the appropriate levels of granularity.
How should you complete the measure? To answer, drag the appropriate values to the correct targets. Each value may be used once, more than once, or not at all. You may need to drag the split bar between panes or scroll to view content.
NOTE: Each correct selection is worth one point.

You need to create a calculated column to display the month based on the reporting requirements. Which DAX expression should you use?
You attempt to connect Purer 81 Desktop to a Cassandra database.
From the Get Data connector list you discover that there is no specific connector for the Cassandra database,
You need to select an alternate data connector that will connect to the database.
Which of connector should you choose?
You have a Power Bl report named Report1 and a dashboard named Dashboard1, Report1 contains a line chart named Sales by month.
You pin the Sales by month visual to Dashboard1.
In Report1, you change the Sales by month visual to a bar chart.
You need to ensure that bar chart displays on Dashboard1.
What should you do?
You create a dataset sourced from dozens of flat files in Azure Blob storage. The dataset uses incremental refresh.
From powerbi.com, you deploy the dataset and several related reports to Microsoft Power BI Premium
capacity.
You discover that the dataset refresh fails after the refresh runs out of resources.
What is a possible cause of the issue?
You need to recommend a strategy to consistently define the business unit, department, and product category data and make the data usable across reports.
What should you recommend?
You merge data from Sales.Region, Region_Manager, Sales_Manager, and Manager into a single table named Region. What should you do next to meet the reporting requirements of the executives?
What should you create to meet the reporting requirements of the sales department?
