An organization has a customer database of 3000 customers and has accumulated 5 years of sales data. They want to make decisions about which products to retire and which to continue to offer. Management has turned to the analytics team to analyze the data and provide recommendations. The analytics team develops a survey to send to randomly selected customers.This is an example of:
A company wants to run a monthly promotion on batteries that cost 15 cents each and sells for 50 cents. At this price, they typically sell 1000 batteries and generate a profit of 35 cents per battery for a total profit of $350. The analytics team was asked to test two price points - 20% off (i.e. a sale price of 40 cents) and 40% off (i.e., a sale price of 30 cents). The survey data completed by 10000 participants was analyzed and showed that a 20% savings would result in sales of 1200 batteries and the 40% savings would result in 1800 batteries being sold. The team's initial recommendation was to recommend the 40% discount. Now that they are validating their recommendations, they decide to:
From a prior analytics study, a telecommunications company has concluded that due to the maturity of the market the cost of obtaining new customers is on the rise. As a result, the company wants to increase their efforts on retaining customers. One of the key performance indicators that will help them track their progress in this area is the rate at which customers leave/unsubscribe from their services over a given time period.Which performance indicator is this referring to?
The results for a certification exam were revealed in percentage and percentile. How would you infer the results for an attendee at: 75%, 90th percentile?
While formulating the results from completed analysis, the analytics team is applying different techniques to determine an optimal solution to the specified business problem. Which of the following runs the risk of introducing bias in their decision making process?
DIAGRAM TAKEN
An analyst at an organization has just learnt about bullet charts. For the latest dashboard, the analyst has decided to display the customer satisfaction rate from the latest 2018 customer survey results through a bullet chart while comparing it to the 2017 customer satisfaction rate.What can be gleaned from this chart?
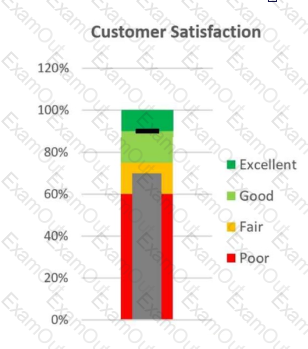
Customer Satisfaction
120%
100%
80%
The data analysis completed by the analytics team points to three potential options that could be recommended by the team each of which will help their organization meet their desired goal. Given that there is no significant difference in the results that each option would provide, the team will reach a final recommendation by determining value to be delivered to specific parts of the organization and:
A small business has recently launched their website and wants to understand how the website is being used. In particular, there is interest in identifying which areas of each page receive the most attention. The analyst has decided to communicate this information by displaying the top pages overlaid with colours denoting the volume of clicks.What type of visualization technique is being used here?
A toy manufacturing company wants to improve operational efficiencies as a means of reducing costs. The Operational Manager wants an analytics study to identify areas of improvement within their operational processes. During a meeting with the analyst, the Operational Manager mentions concerns about old machinery and suggests this be the area of focus for the study. They can have a touchpoint in three weeks to assess progress. Has the Operational Manager limited the potential of this study?
A clinical research organization is using predictive analytics to improve patient safety and decrease costs on its clinical trials. To ensure that a standard set of tools/techniques is identified and best practices adhered to, teams are required to create scenarios to generate appropriate data for initial analysis. This practice is required because it is almost certain that data will be difficult to come by for most research. Which concern would lead the team to establish scenario development as a required technique?
