A large car manufacturer is interested in comparing the number of sales for a specific model of electric car across all 50 US states.
The data analytics team sourced and acquired the data, and the business analyst created the model to compare sales across states.
In a meeting to review the results, the feedback received included several complaints concerning an inability to distinguish the number of sales per state. What model would result in such confusion?
There were 7 students enrolled in the Introduction to Artificial Intelligence course. These were the student's scores from the final exam: 64, 70, 80, 80, 90, 98, 100
What is the mean and mode for the outlined scores?
An analyst at a phone manufacturing company is preparing a dashboard for Senior Executives that will cover past year's performance. It will be used in the upcoming senior leadership team meeting to make strategic decisions for the new year. While analyzing the data, the analyst found a lot of interesting revelations related to performance. What should the analyst keep in mind when preparing the Executive dashboard?
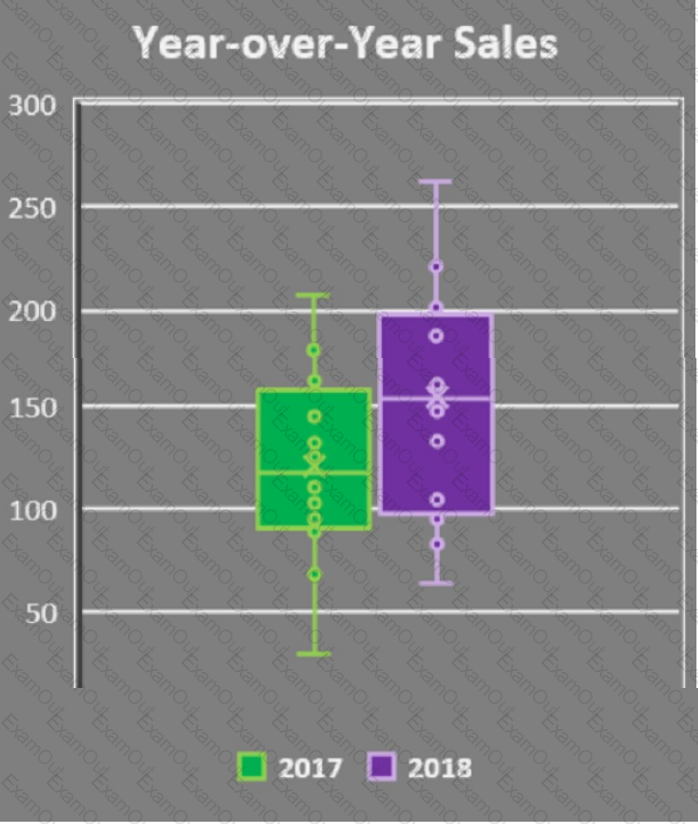
A software company launched a new product in late 2016. The product manager is reviewing a Box and Whisker plot used to compare year-over-year sales, from 2017 to 2018. What is the conclusion he can make from this chart?
A business analyst constructs a model they would like to review with key business stakeholders but decides to review the model first with the data scientist who has performed the data analysis. The data scientist provides some suggestions on how to reduce the complexity in the model. One suggestion is to use color to group objects needing to be associated. The data scientist is
encouraging using which Gestalt Principle of Perception with regards to data visualization?
