You are designing a stateful data processing pipeline that reads data from a Cloud Storage bucket and writes transformed data to a BigQuery table. The pipeline must be highly available and resilient to zonal failures within the us-central1 region. You need to configure a Dataflow pipeline ensuring minimal disruption during a zonal outage. What should you do?
You are migrating your on-premises data warehouse to BigQuery. As part of the migration, you want to facilitate cross-team collaboration to get the most value out of the organization's data. You need to design an architecture that would allow teams within the organization to securely publish, discover, and subscribe to read-only data in a self-service manner. You need to minimize costs while also maximizing data freshness What should you do?
You work for a large real estate firm and are preparing 6 TB of home sales data lo be used for machine learning You will use SOL to transform the data and use BigQuery ML lo create a machine learning model. You plan to use the model for predictions against a raw dataset that has not been transformed. How should you set up your workflow in order to prevent skew at prediction time?
You plan to deploy Cloud SQL using MySQL. You need to ensure high availability in the event of a zone failure. What should you do?
You have a streaming pipeline that ingests data from Pub/Sub in production. You need to update this streaming pipeline with improved business logic. You need to ensure that the updated pipeline reprocesses the previous two days of delivered Pub/Sub messages. What should you do?
Choose 2 answers
Flowlogistic’s CEO wants to gain rapid insight into their customer base so his sales team can be better informed in the field. This team is not very technical, so they’ve purchased a visualization tool to simplify the creation of BigQuery reports. However, they’ve been overwhelmed by all thedata in the table, and are spending a lot of money on queries trying to find the data they need. You want to solve their problem in the most cost-effective way. What should you do?
Flowlogistic is rolling out their real-time inventory tracking system. The tracking devices will all send package-tracking messages, which will now go to a single Google Cloud Pub/Sub topic instead of the Apache Kafka cluster. A subscriber application will then process the messages for real-time reporting and store them in Google BigQuery for historical analysis. You want to ensure the package data can be analyzed over time.
Which approach should you take?
Flowlogistic’s management has determined that the current Apache Kafka servers cannot handle the data volume for their real-time inventory tracking system. You need to build a new system on Google Cloud Platform (GCP) that will feed the proprietary tracking software. The system must be able to ingest data from a variety of global sources, process and query in real-time, and store the data reliably. Which combination of GCP products should you choose?
Flowlogistic wants to use Google BigQuery as their primary analysis system, but they still have Apache Hadoop and Spark workloads that they cannot move to BigQuery. Flowlogistic does not know how to store the data that is common to both workloads. What should they do?
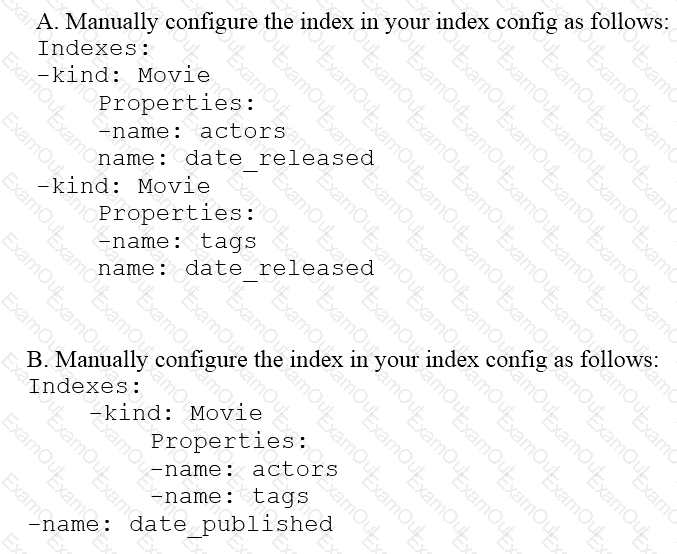
You are deploying a new storage system for your mobile application, which is a media streaming service. You decide the best fit is Google Cloud Datastore. You have entities with multiple properties, some of which can take on multiple values. For example, in the entity ‘Movie’ the property ‘actors’ and the property ‘tags’ have multiple values but the property ‘date released’ does not. A typical query would ask for all movies with actor=<actorname> ordered by date_released or all movies with tag=Comedy ordered by date_released. How should you avoid a combinatorial explosion in the number of indexes?