Weekend Sale - Limited Time 70% Discount Offer - Ends in 0d 00h 00m 00s - Coupon code: sntaclus

An analyst is co-creating a report with their client counterpart in preparation for a running marketing performance dashboard. Marketing is still getting onboarded with the analytics tool and hope to begin leveraging data to enable data-driven decisions.

How would the analyst look to share out the dashboard broadly across the team?

A.

Share a PDF at the time the report is completed to the client counterpart and the greater marketing team

B.

Share Can Edit rights with the client counterpart and Can View rights with the entire marketing ® team

C.

Share Can Edit rights with the client counterpart and Can Duplicate rights with the entire marketing team

A data analyst wants to create a segment of traffic that started on the page "Facebook App Home" and accessed the "Home Page" in Analysis Workspace.

Based on the project presented below:

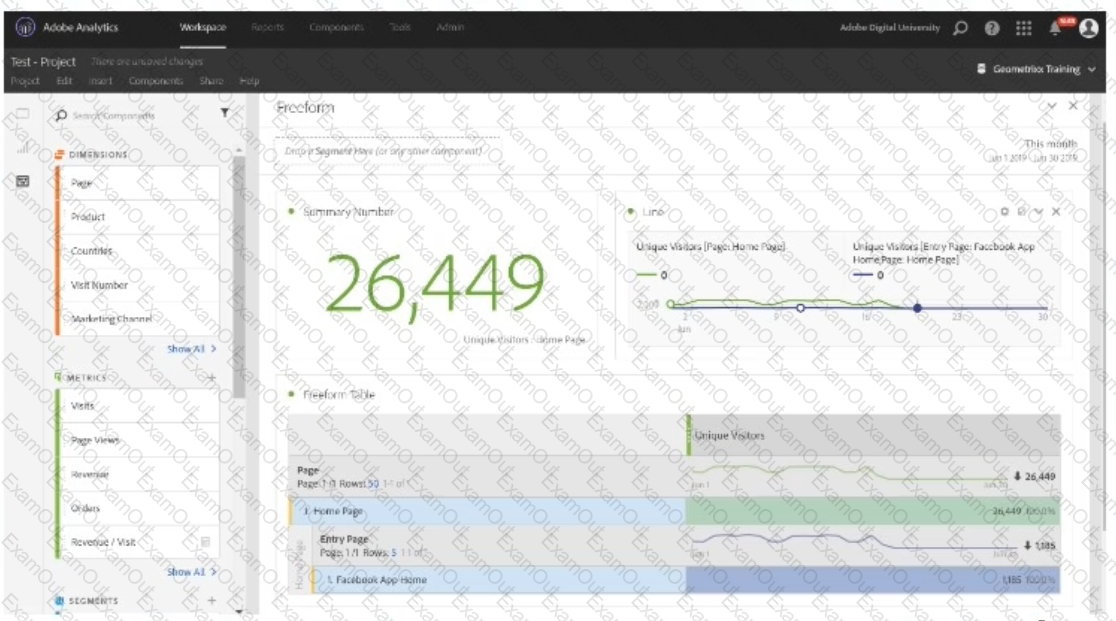
What is the proper way to create this segment and continue working on the project without loss of data?

A.

Click and select "Home Page" and "Facebook App Home" in the table. Then right click on the selection and choose to Create a Segment from Selection, and save the segment with the exact configuration that has been automatically defined.

B.

Click on the Main Menu Components, then on segments, and create a new segment of a VISITOR container with entry page equals "Facebook App Home" AND page equals "Home Page".

C.

Click on the Internal Menu of the Components project, then on New Segment, and create a segment of a VISIT container with entry page equals "Facebook App Home" AND page equals "Home Page".

In which order are these data components processed?

A.

Page code > VISTA Rules > Marketing Channel Rules > Processing Rules

B.

Page code > Processing Rules > VISTA Rules > Marketing Channel Rules

C.

Marketing Channel Rules > Page code > Processing Rules >VISTA Rules

In which two visualizations is the Anomaly Detection report available? (Choose two.)

A.

Ranked Freeform Table

B.

Line Visualization by Day

C.

Trended Freeform Table

D.

Line Visualization by Week

The Chief Marketing Officer has established a monthly revenue target for an online store and wants to see how revenue for the current month is tracking towards that goal.

Which Visualization should be used for this report?

A.

Treemap

B.

Bullet

C.

Scatter