Weekend Sale - Limited Time 70% Discount Offer - Ends in 0d 00h 00m 00s - Coupon code: sntaclus

For a Normal Distribution as samples size increases the Range in Mean and Standard Deviation decrease relative to the Mean and Standard Deviation of the population.

A.

True

B.

False

Choose those characteristics of a Simple Linear Regression (SLR) Analysis that are applicable. (Note: There are 3 correct answers).

A.

The Correlation Coefficient is always greater than the Regression Coefficient in a SLR

B.

General Regression Analysis deals only with Continuous Data

C.

Non-linear Regressions can explain curvature when with more statistical confidence than Linear Regressions

D.

SLR can help quantify the significance of variation in X that influences the variation in Y via a mathematical equation

E.

A Correlation does not explain causation but a Regression Analysis with a statistically valid mathematical equation does explain causation

Two of the key deliverables for the Measure Phase are a robust description of the process and its flow and an assessment of the Measurement System.

A.

True

B.

False

A valid Multiple Linear Regression (MLR) is characterized by all of these except?

A.

It is an assumption that the X’s (inputs) are not correlated to each other

B.

The X’s (inputs) are assumed to be independent of each other

C.

The Residuals from MLR analysis have to be Normally Distributed

D.

MLR is conducted based on a deliberate form of experimentation

E.

It is not possible to evaluate interactions in a MLR analysis

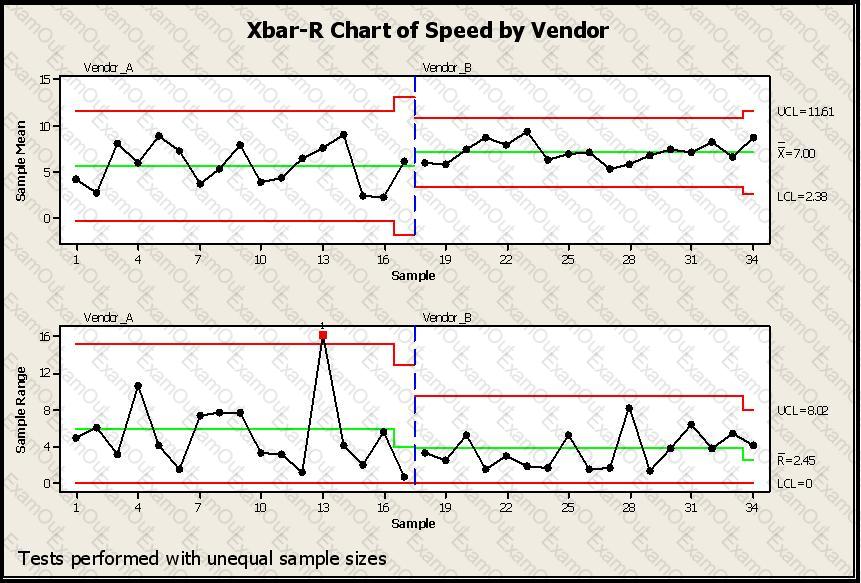
SPC Charts are used extensively in different business and decision-making environments. In this example a vendor is being selected based on speed of delivery. Which of the conclusions would help you pick a vendor for your needs regarding lead-time of delivery from your vendors? (Note: There are 4 correct answers).
A.

Vendor A with a much shorter lead time in delivery

B.

Vendor B as it has a better consistency (lower variance) on lead time

C.

Vendor B as Vendor A shows a situation out of control as shown in red

D.

Vendor B as the Control Limits are much narrower than Vendor A

E.

Vendor B with higher lead time, but a process with much narrower Control Limits

A Factorial Experiment based on a Level 2 Design with 6 factors would require 16 runs to fully assess the interactions.

A.

True

B.

False

The Normal Distribution is considered to be the most important distribution in statistics and, among other things is defined as having a total area under the curve of 1, is mounded and symmetrical and the Mean, Median and Mode are _____________.

A.

All evenly divisible by 3

B.

Twice the Standard Deviation

C.

Within 10% of each other

D.

The same number

At the very initiation of a project a Belt must develop a concise _______________ that states at a high level the area of concern and why it is important this issue be improved.

A.

Business Case

B.

Project Doctrine

C.

Management Justification

D.

Process Owner Disclosure

Special Cause Variation falls into which two categories?

A.

Natural & Unnatural

B.

Short Term & Long Term

C.

Assignable & Pattern

D.

Attribute & Discreet

Cost of Poor Quality (COPQ) can be classified as Visible Costs and Hidden Costs. All these items are Hidden Cost except __________________.

A.

Lost Customer Loyalty

B.

Returns

C.

Time Value of Money

D.

Late Delivery