You have a scatter plot visualization.
What should you do to configure the visualization as a density map?
Which of the following are valid ways to show Mark Labels in the visualisation?
Which of the following are valid objects when creating a dashboard in Tableau? Choose 4.
When exporting a worksheet as an image in Tableau, which of the following file formats are available?
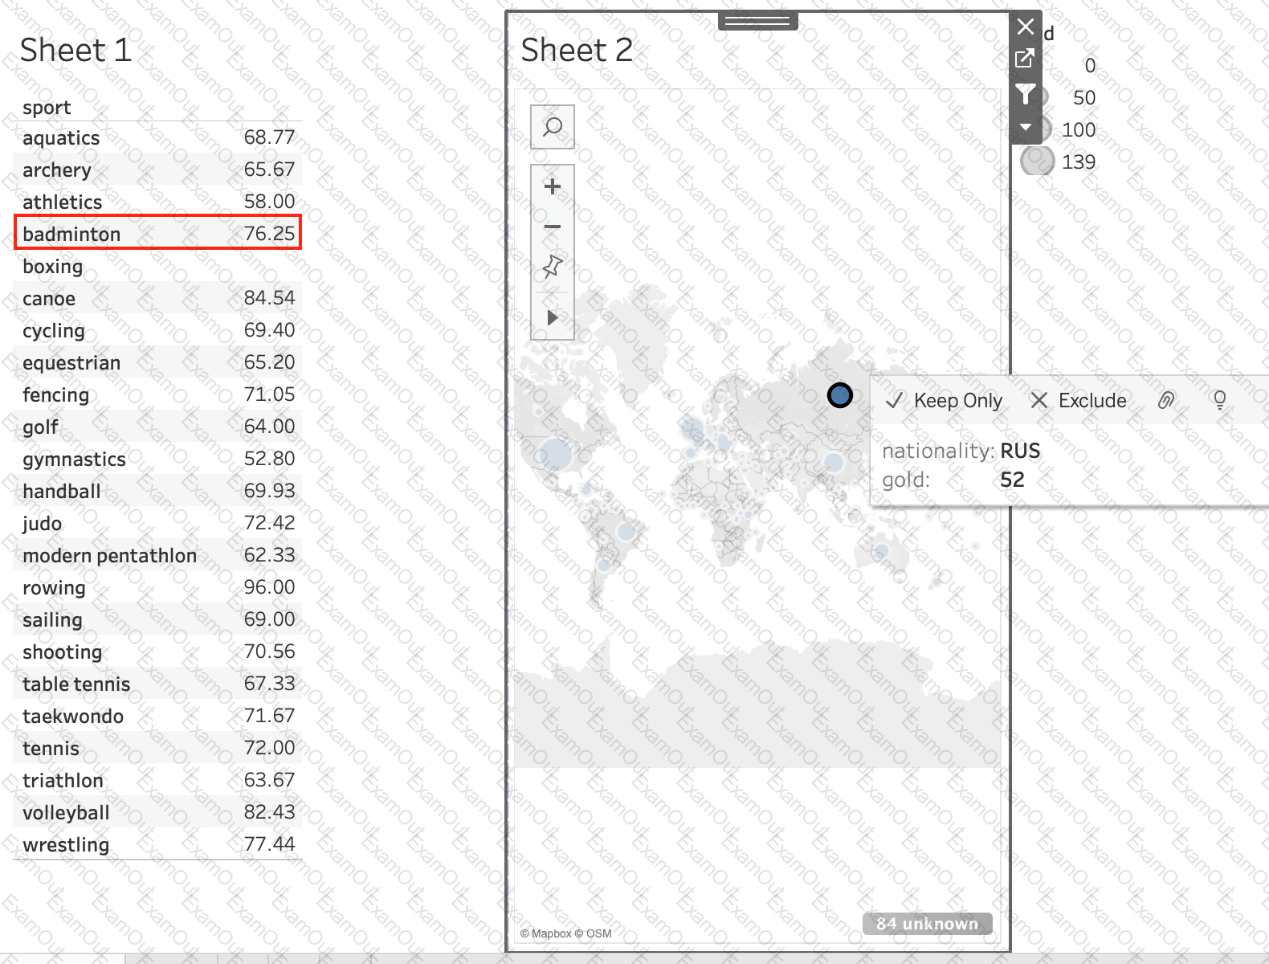
Using the atheletes table:
i) Create a sheet with a crosstab showing the Average weight for each sport (Sheet 1)
ii) Create a sheet with a Map showing the Total number of gold medals per Country. Use size as a Mark. (Sheet 2)
Now, Create a Dashboard containing both these sheets, and Use Sheet 2 as a Filter for Sheet 1. What was the average weight for Badminton in Russia?
(Ignore any nulls / unknowns)
How does Tableau know at which level to aggregate values?
Which two filter modes can you use with dimension filters? Choose two
Which of the following are valid Dashboard size options?
What are two examples of a date value?
Choose two.
You have a workbook that contains one data source and you need to combine data from another database. What should you do first?
