You have a continuous numeric measure named Sales.
Which chart type is created when you double-click the Sales measure?
You have a dashboard that shows car rental statistics by city, including a field named Car Dropoff City in the view. A URL action in the dashboard uses https://en.wikipedia.org/wiki/
When you click Salt Lake City in the view, to where will the URL action direct you?
Which of the following calculations DO NOT need a quick table calculation?
In which of the following scenarios would having a live connection be more beneficial than using an extract?
Which of the following is the correct way to calculate Profit Ratio in Tableau?
A Tableau Data Source File (.tds) contains which of the following?
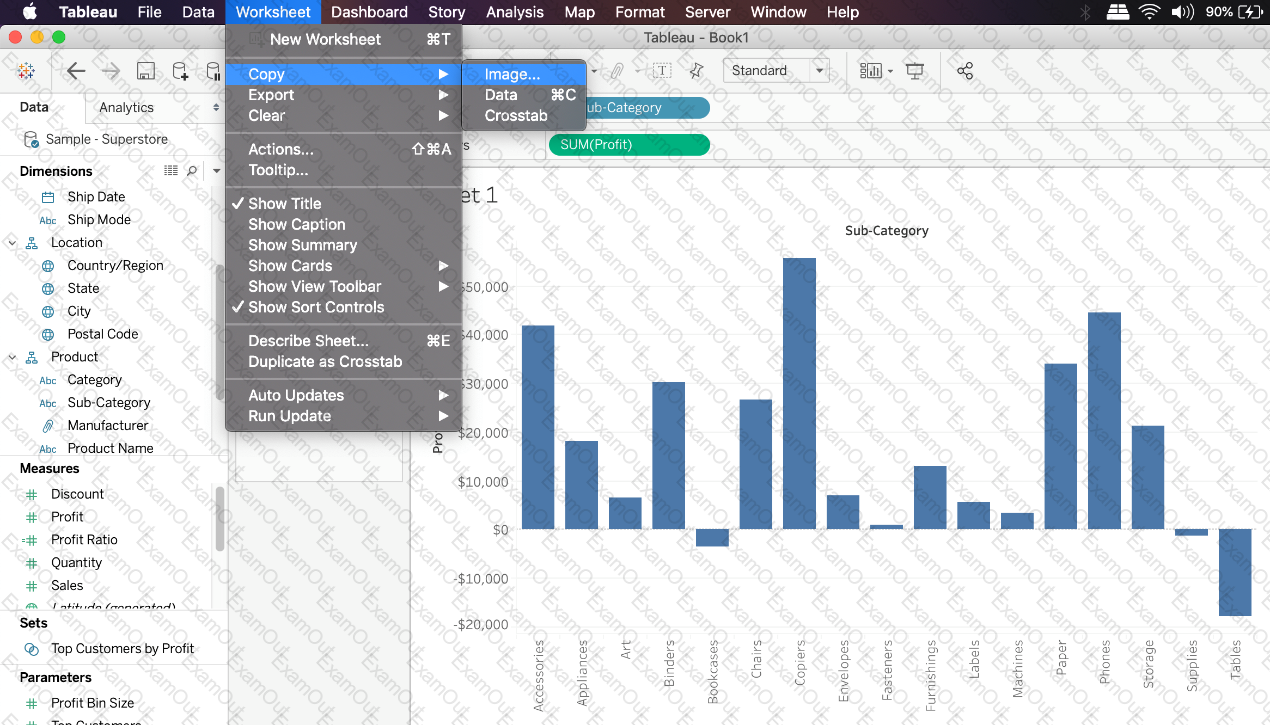
Which of the following are valid ways to copy a worksheet visualisation as an image?
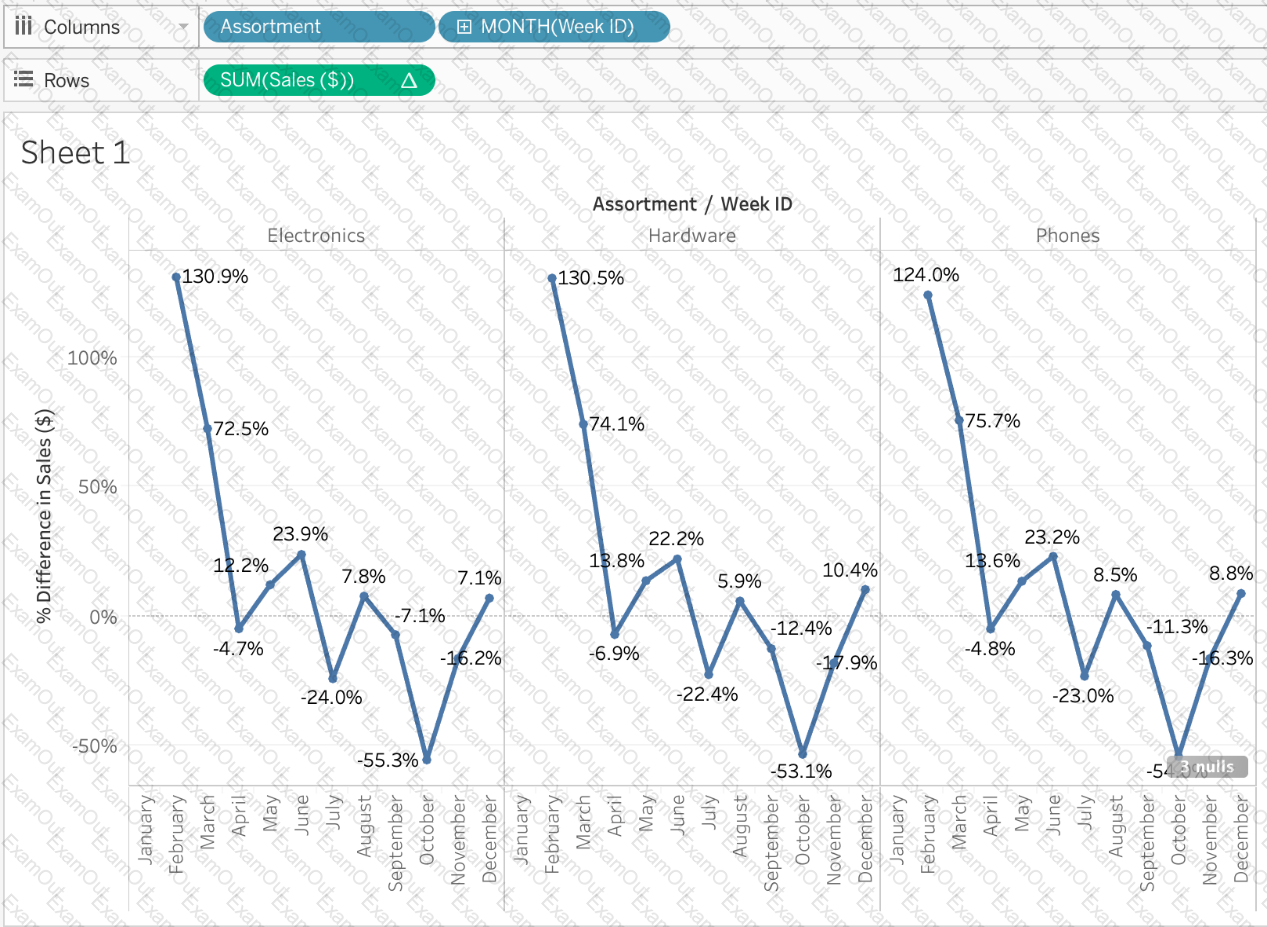
Using the Time Series Table, create a Line chart showing the Monthly Year over Year Growth for the Sales, broken down by Assortment. For the Electronics assortment, which Month had the most NEGATIVE value of Year over Year Growth?
Using the Time Series Table, create a Line chart showing the Monthly Year over Year Growth for the Sales, broken down by Assortment. For the Electronics assortment, which Month had the most NEGATIVE value of Year over Year Growth?
Which two statements accurately describe a visualization animation? Choose two
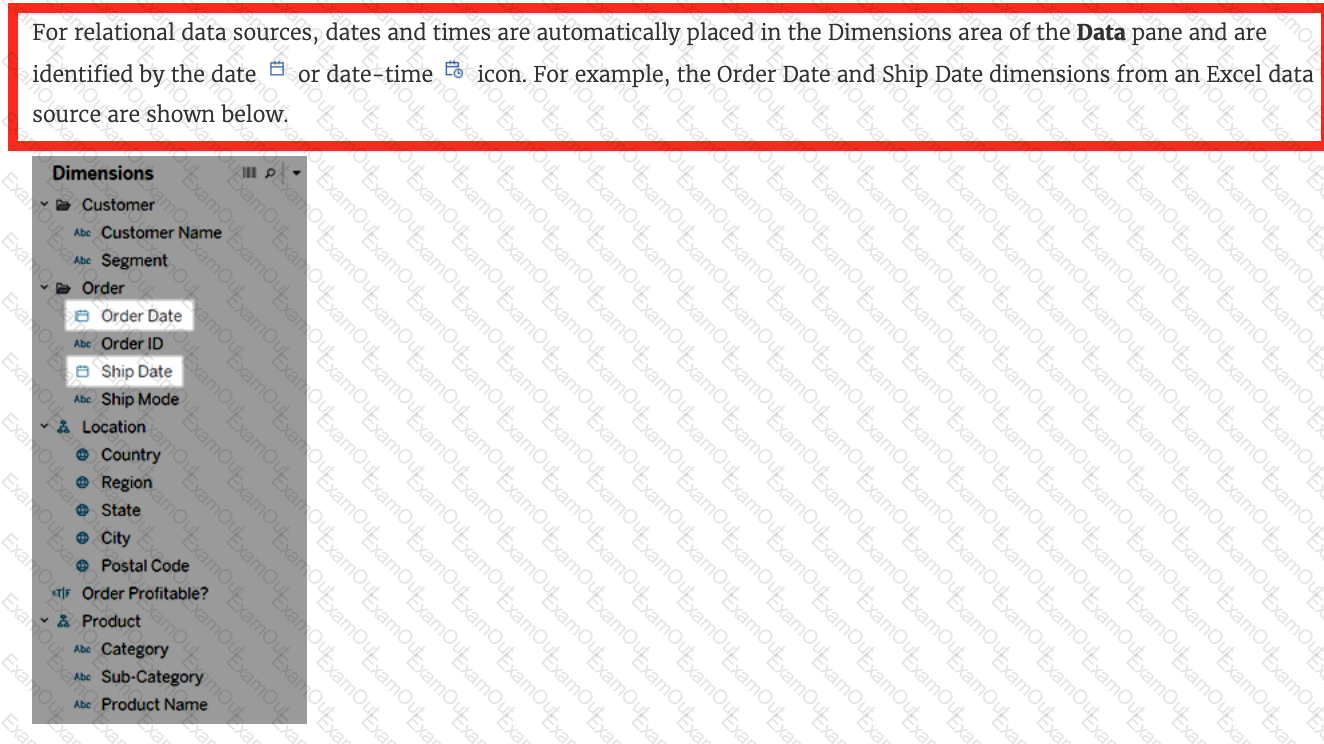
Which of the following are true about dimensions?