You need to create a Power Bl theme that will be used in multiple reports. The theme will include corporate branding for font size, color, and bar chart
formatting.
What should you do?
You are creating an analytics report that will consume data from the tables shown in the following table.
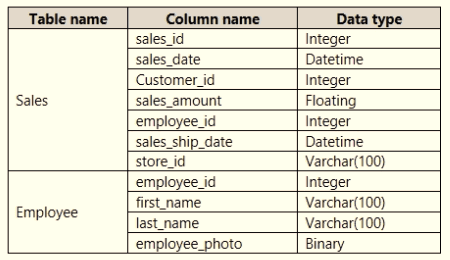
There is a relationship between the tables.
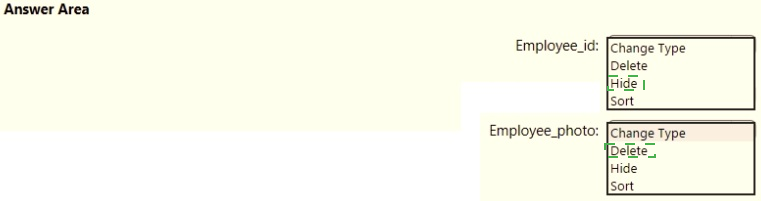
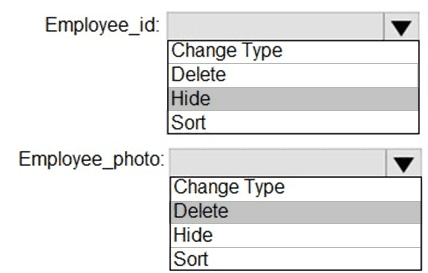
There are no reporting requirements on employeejd and employee_photo.
You need to optimize the data model
What should you configure for employeejd and employee.photo? To answer, select the appropriate options in the answer area.

You use Power Query Editor to Import three tables named Customers. Address, and Country.
In the source system, not every customer has a related address, but every address has a related country.
You need to merge all the tables into a single query. The solution must optimise query refresh performance.
Which type of join should you use for each merge operation? To answer, drag the appropriate join types to the correct operations. Each join type may be used once, more than once, or not at all. You may need to drag the split bar between panes or scroll to view content.
NOTE: Each correct selection it worth one point.


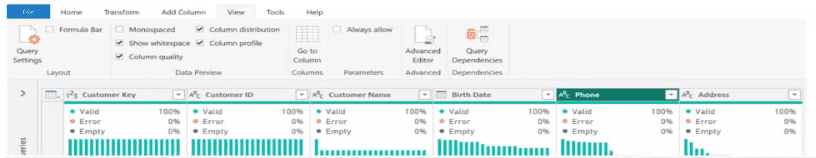
You have a Power BI semantic model.
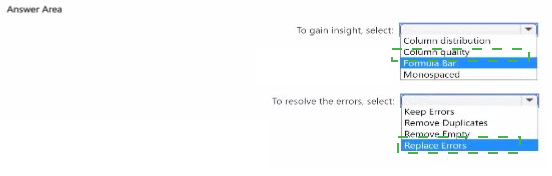
You discover that he semantic model contains values that display as errors.
You need to use data profiling feature in Power Query to preview the date and identify the issues.
What should you select to gain into the number of errors in the model, and what should you select to resolve the errors? To answer, select the appropriate options in the answer area.
NOTE: Each correct answer is worth one point.

You have a Power Bl semantic model that contains the following tables.
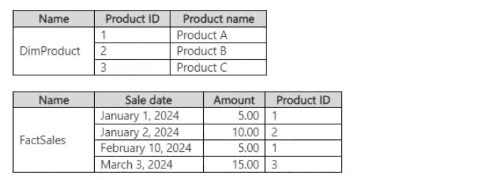
You need to define a relationship from FactSales to DimProduct. The solution must ensure the fastest DAX query performance.
Which cardinality should you use?
You have multiple dashboards.
You need to ensure that when users browse the available dashboards from powerbi.com. they can see which dashboards contain Personally Identifiable Information (Pll). The solution must minimize configuration effort and impact on the dashboard design.
What should you use?
From Power BI Desktop, you publish a new dataset and report lo a Power Bl workspace. The dataset has a row-level security (RLS) role named HR. You need to ensure that the HR team members have RLS applied when they view reports based on the dataset. What should you do?
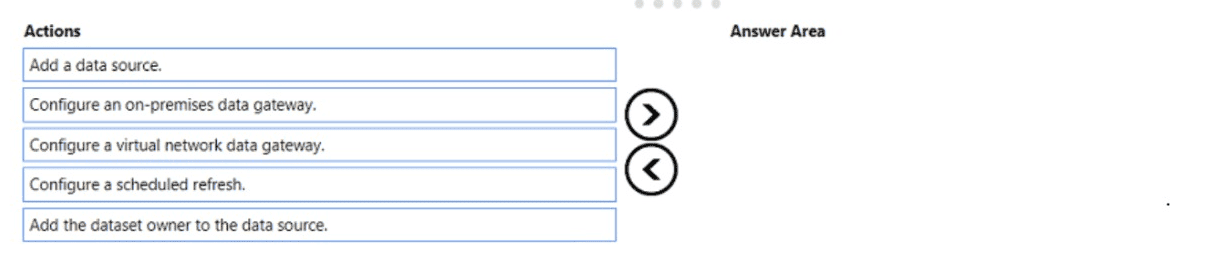
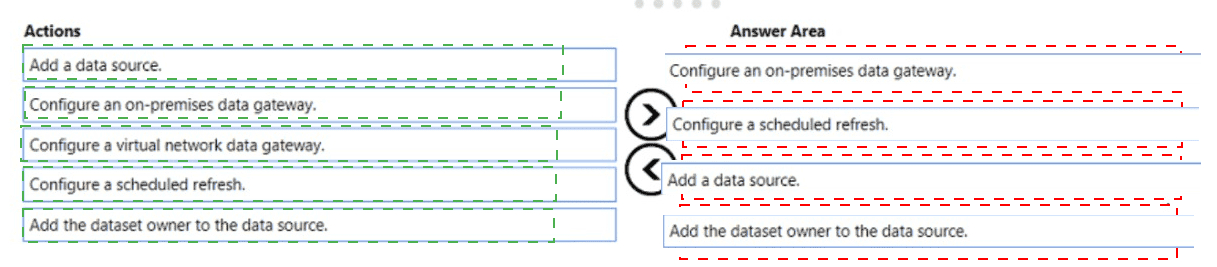
You publish a dataset that contains data from an on-premises Microsoft SQL Server database.
The dataset must be refreshed daily.
You need to ensure that the Power BI service can connect to the database and refresh the dataset.
Which four actions should you perform in sequence? To answer, move the appropriate actions from the list of actions to the answer area and arrange them in the correct
You have sales data in a star schema that contains four tables named Sales, Customer, Date, and Product.
The Sales table contains purchase and ship dates.
Most often, you will use the purchase date to analyze the data, but you will analyze the data by both dates independently and together.
You need to design an imported dataset to support the analysis. The solution must minimize the model size and the number of queries against the data source.
Which data modeling design should you use?
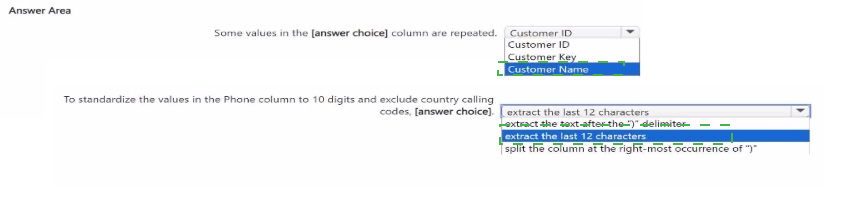
You have a query that contains customer data in Power Query Editor as shown in the following exhibit.