A quality leader who did extensive work with Japanese industry is:
The Central Limit Theorem states that the distribution of sample means approximates a normal distribution if:
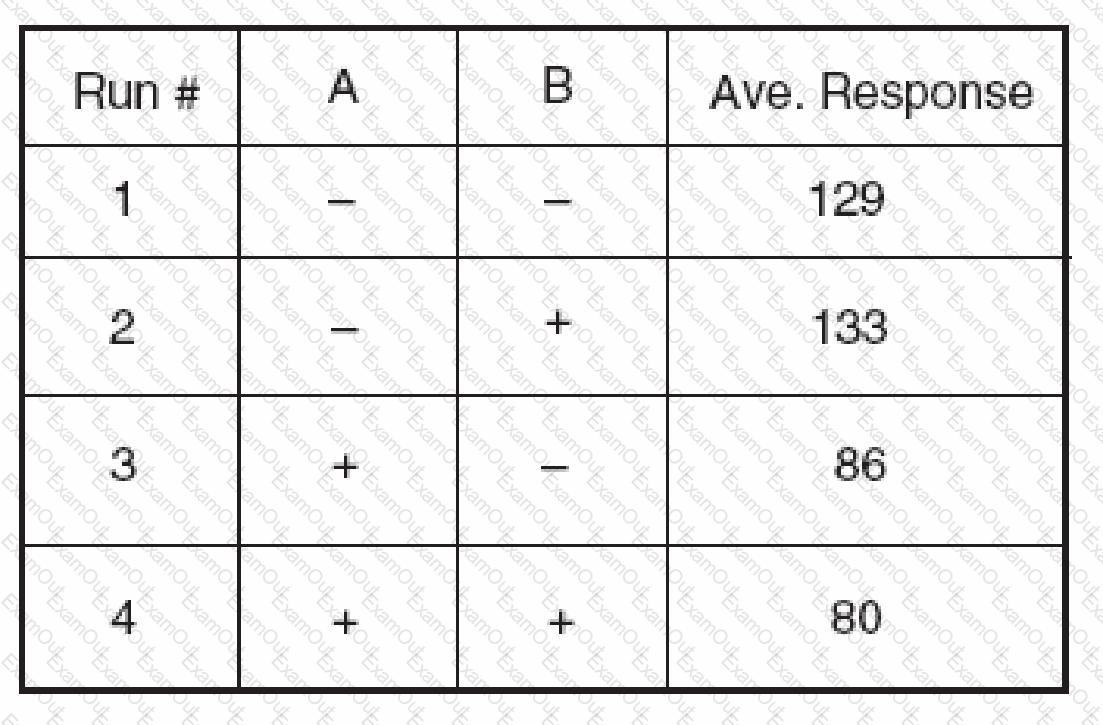
(Refer to the previous problem) The variance of the five replications for each run is calculated. Most of these variances are approximately equal but two are significantly lower than the others. The experimenters would be especially interested in those two runs if they want to optimize:
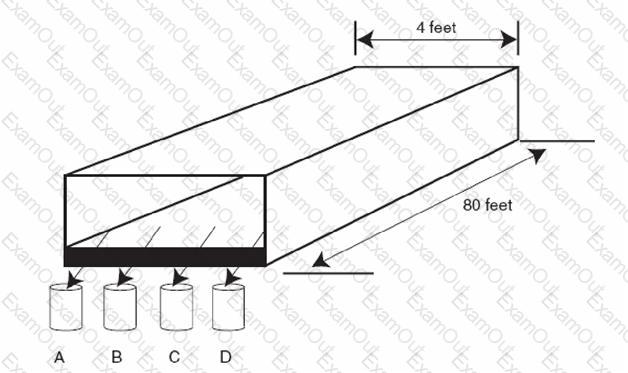
SCENARIO A Six Sigma team is measuring the moisture content of corn starch as it leaves the conveyer belt of a dryer. They collect one sample four cups of starch at times indicated in the chart at fixed locations labeled A, B, C, and D across the end of the belt. See the diagram below.
Find the sample linear correlation coefficient and the sample coefficient of determination for the data in problem VI.11.
A random sample of 2500 printed brochures is found to have a total of three ink splotches. The rate of ink splotches in PPM is:
An automatic gaging system is to be installed in a process. The gage will insert data values into a data base from which machine adjustments will be made automatically. A critical factor in specifying the equipment is:
The following data were collected on the diameters of turned shafts: 2.506 2.508 2.505 2.505. These values are:
I. Attribute data
II. Discrete data
III. Variables data
IV. Continuous data
Is it safe to assume that the interaction effects are negligible?
SCENARIO A Six Sigma team is measuring the moisture content of corn starch as it leaves the conveyer belt of a dryer. They collect one sample four cups of starch at times indicated in the chart at fixed locations labeled A, B, C, and D across the end of the belt. See the diagram below.

The data for a nine hour period are:
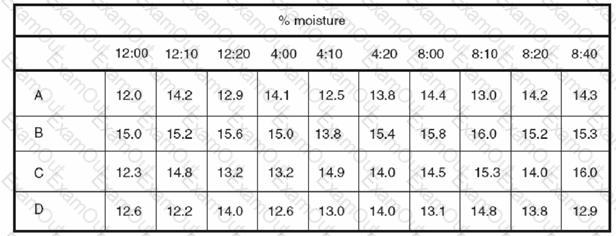
Which type of variation dominates? (Hint: Plot the points on the graph above.)
A team wants a technique for obtaining a large number of possible reasons for excess variation in a dimension. They should use:
