Which of the following statistical methods requires two or more categorical variables?
Which one of the following would not normally be considered a summary statistic?
A data analyst needs to perform a full outer join of a customer's orders using the tables below:
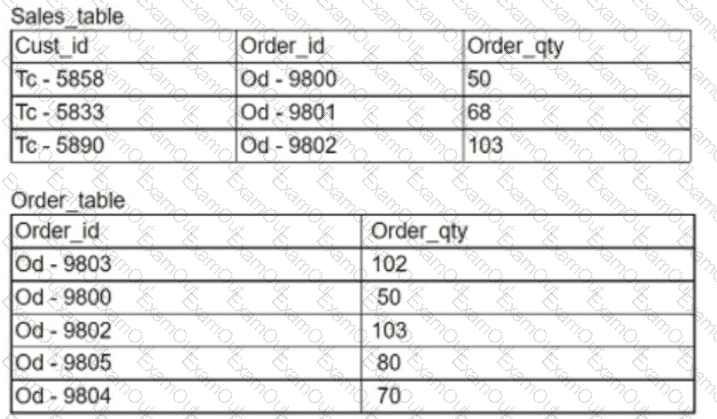
Which of the following is the mean of the order quantity?
Which of the following is a characteristic of a relational database?
A customer survey reveals 90% positive feedback. Which of the following statistical methods would be best to utilize to determine the reliability of a data set and predict how a larger sample of customers over the same time period might respond?
An analyst wants to test the association between the number of doors in a car and the number of gears in the car. Which of the following is the best test to use?
Which of the following best describes the use of a tab sequence?
A company wants to know how its customers interact with an e-commerce website based on clicks over items. Which of the following is the primary requirement for this report?
Which of the following data sampling methods involves dividing a population into subgroups by similar characteristics?
A salesperson who is prospecting potential clients collected the following data:
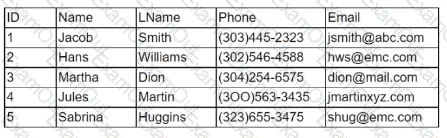
Which of the following is an issue with this data?
